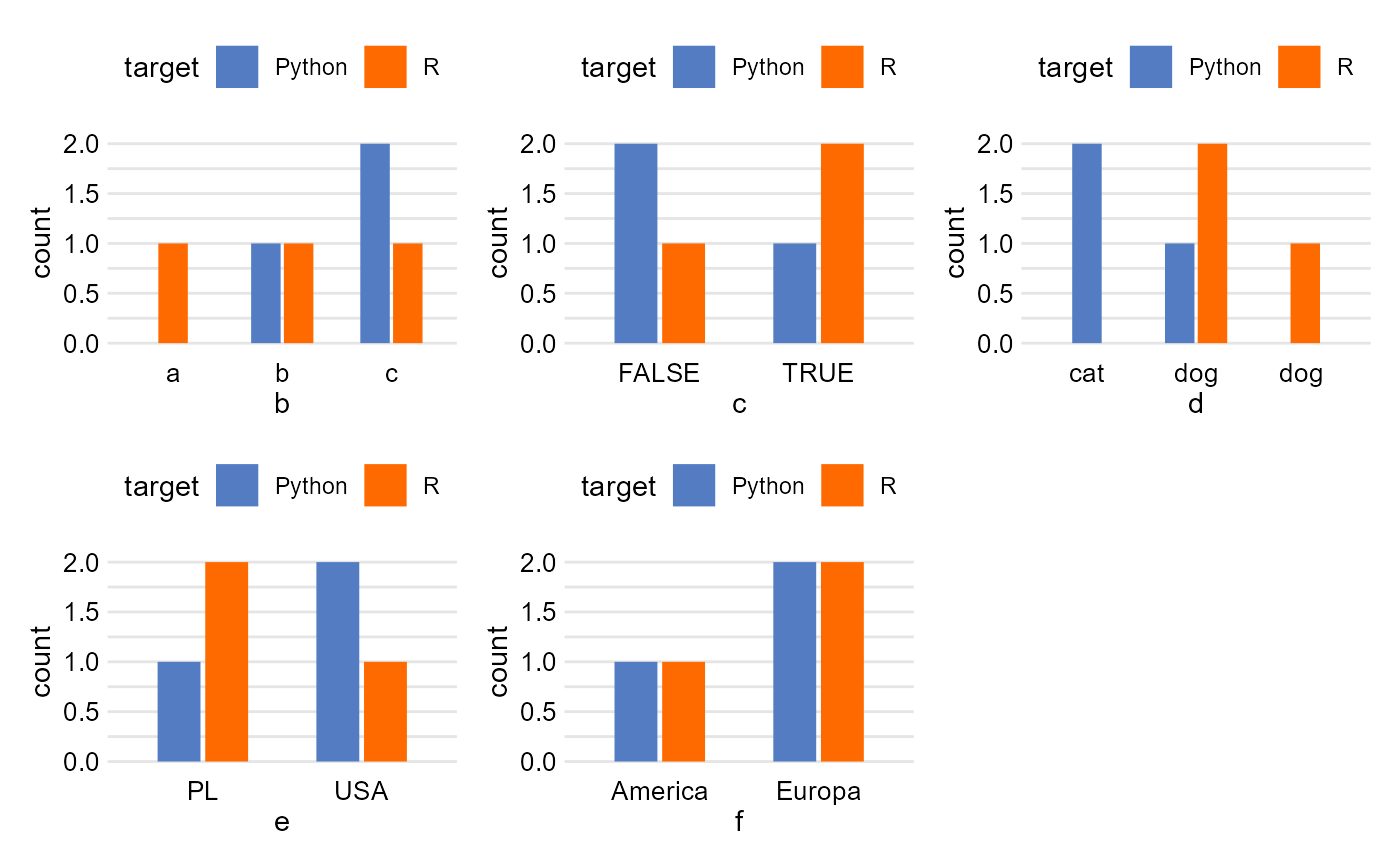
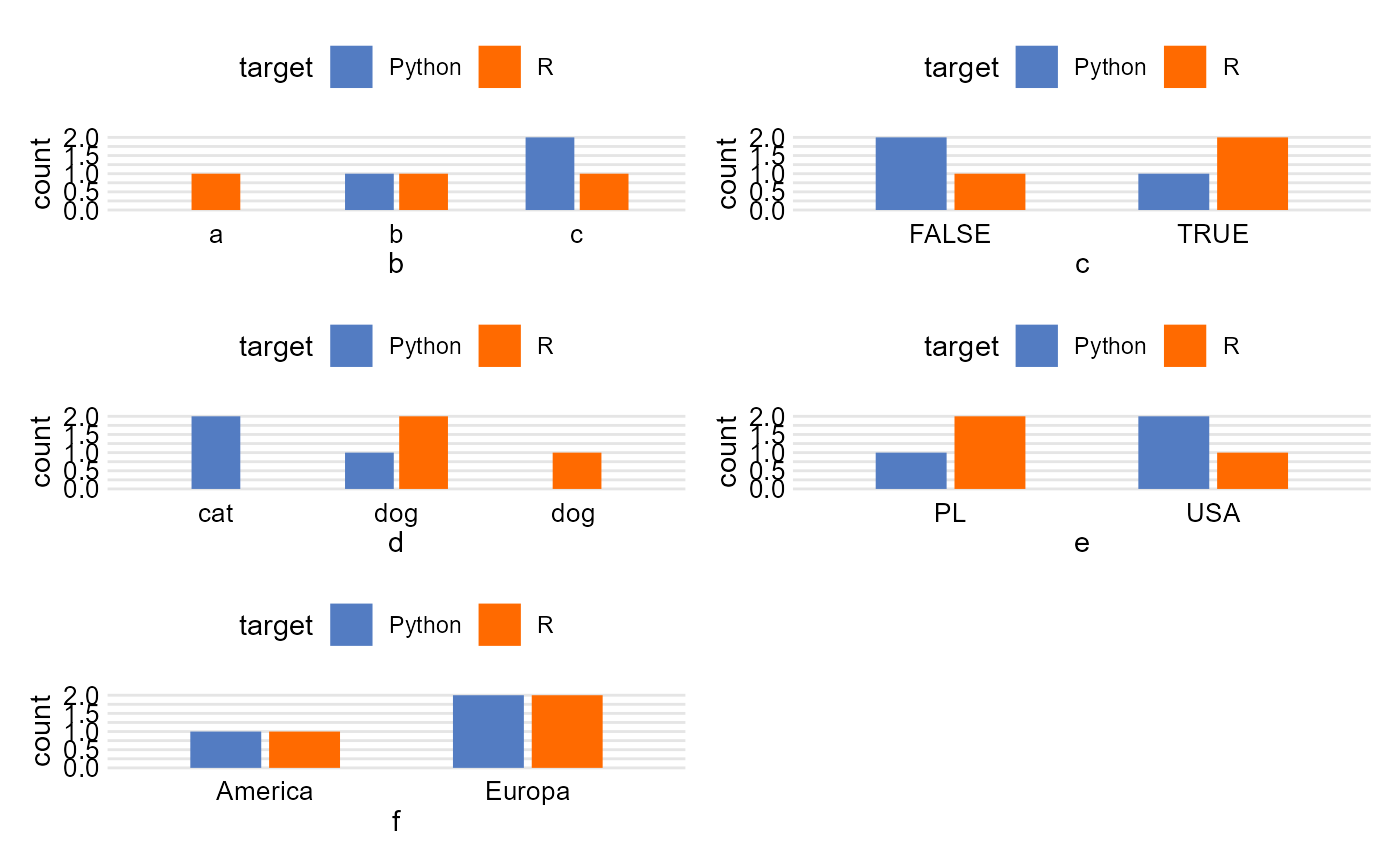
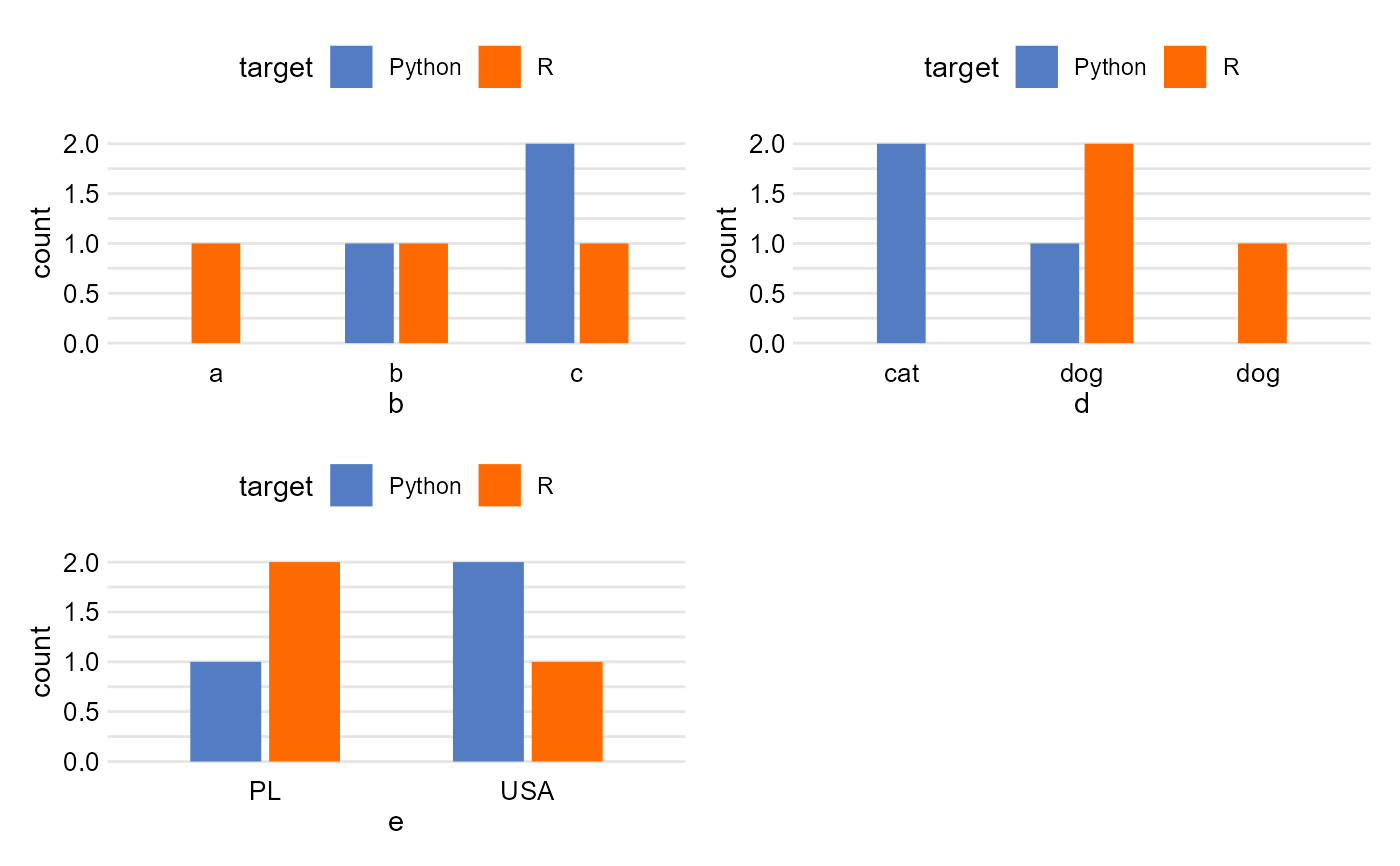
Creates a plot of categorical columns by target
plot_bar_plot(df, target, variables = NULL, col_number = 2)Arguments
- df
data frame
- target
character, name of target column
- variables
vector of column names for which charts are to be made
- col_number
numeric the number of columns in which the charts will be displayed
Value
None
Examples
my_data <- data.frame(
      target = c("R", "Python", "R", "R", "Python", "Python"),
      a = c(1, 2, 3, 4, 2, 2),
      b = c("a", "b", "c", "b", "c", "c"),
      c = c(TRUE, FALSE, TRUE, FALSE, FALSE, TRUE),
      d = c("dog ", "cat", "dog", "dog", "dog", "cat"),
      e = c("PL", "PL", "PL", "USA", "USA", "USA"),
      f = c("Europa", "Europa", "America", "Europa", "America", "Europa")
      )
plot_bar_plot(my_data, "target")

plot_bar_plot(my_data, "target", variables = c("b", "d", "e"))

plot_bar_plot(my_data, "target", col_number = 3)