This function returns bar plots of quality columns of a dataframe
Source:R/plot_bar_qual.R
plot_bar_qual.RdThis function returns bar plots of quality columns of a dataframe
plot_bar_qual(df, variables = NULL)Arguments
- df
A data frame
- variables
A vector of names (or numbers) of columns of which the user wants to create bar plots
Value
Bar plots in k rows and length(variables)/k columns where k is the largest divisor of the number of columns fewer than the number of chosen columns
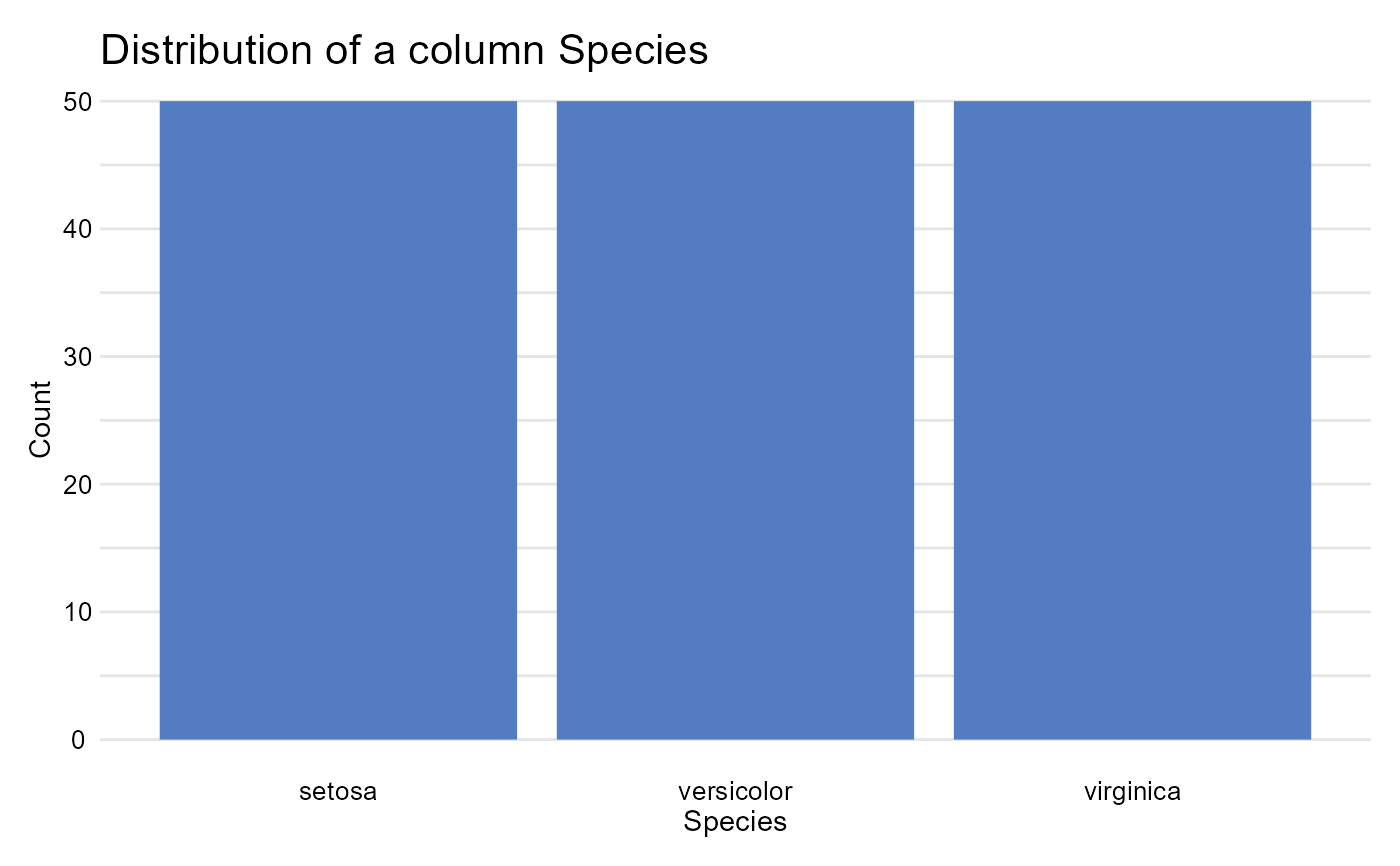
Examples
plot_bar_qual(iris, 5)