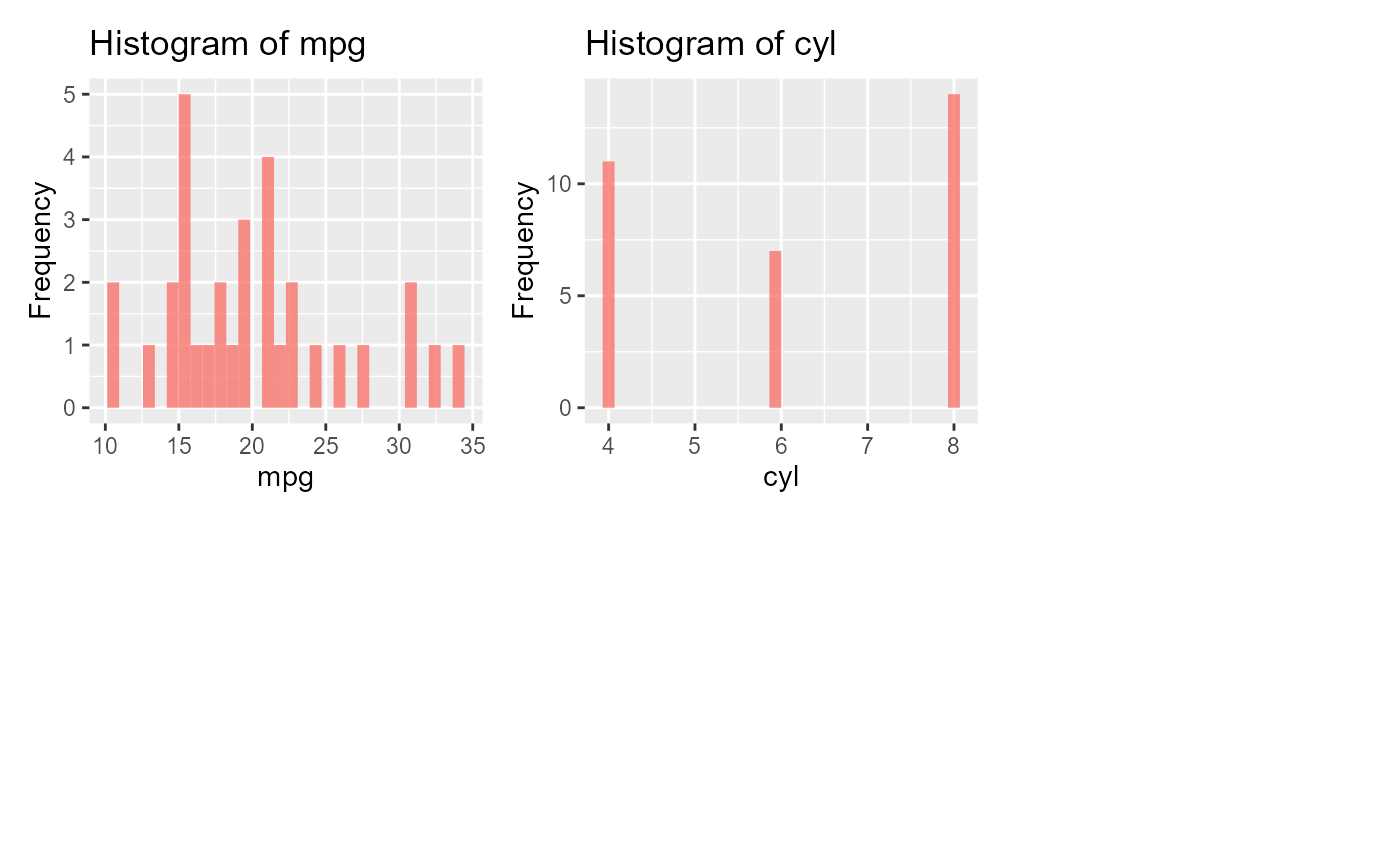
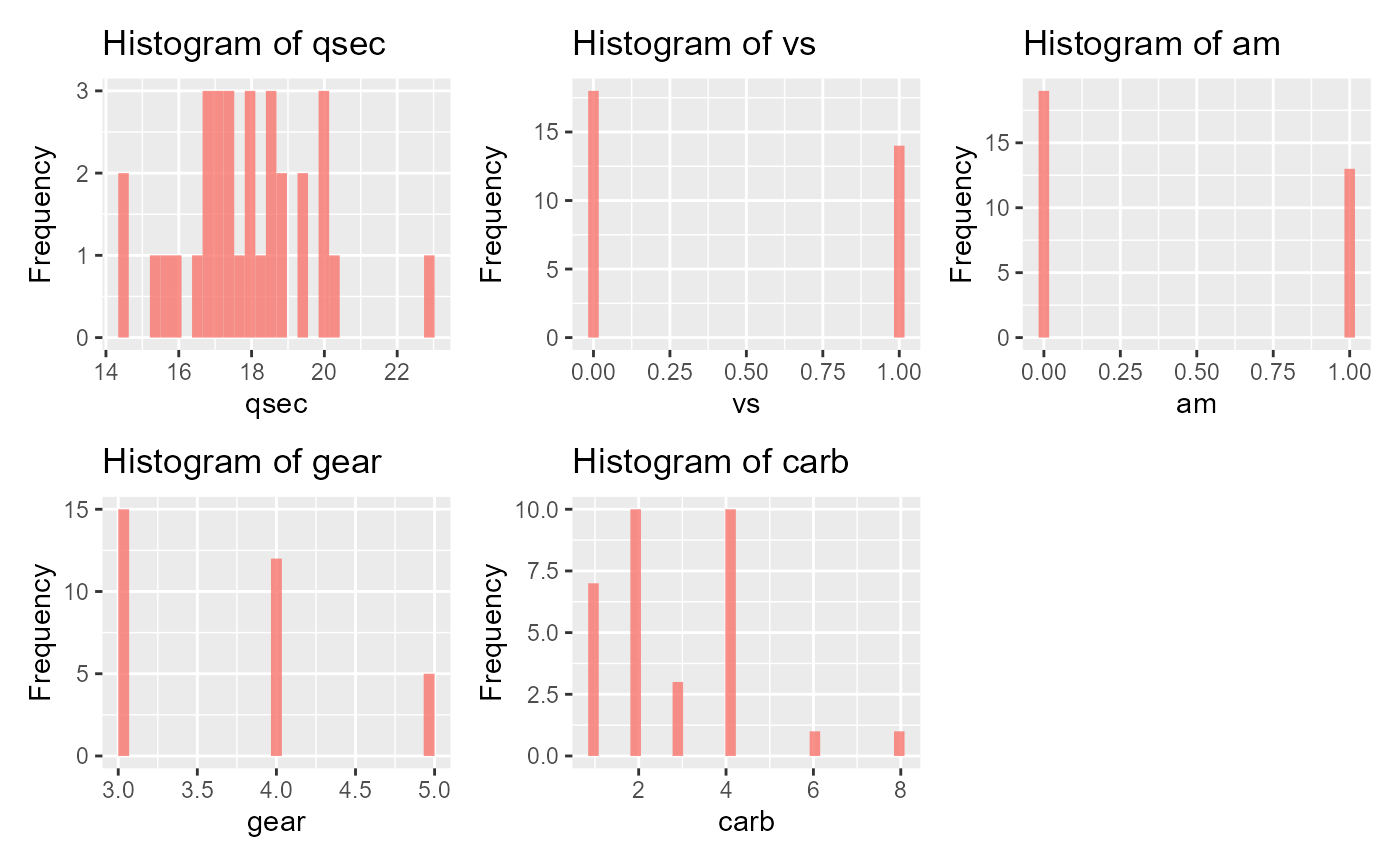
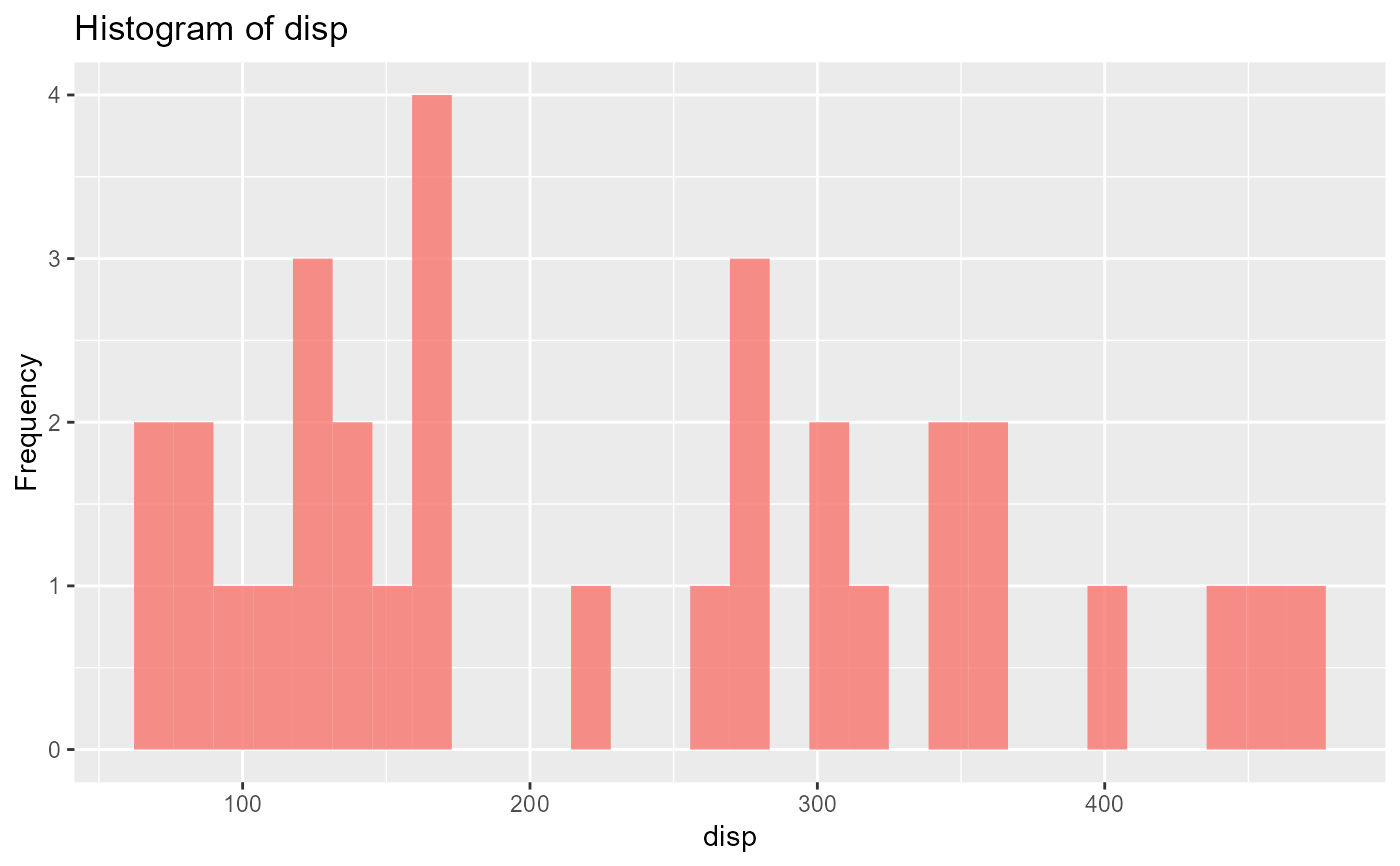
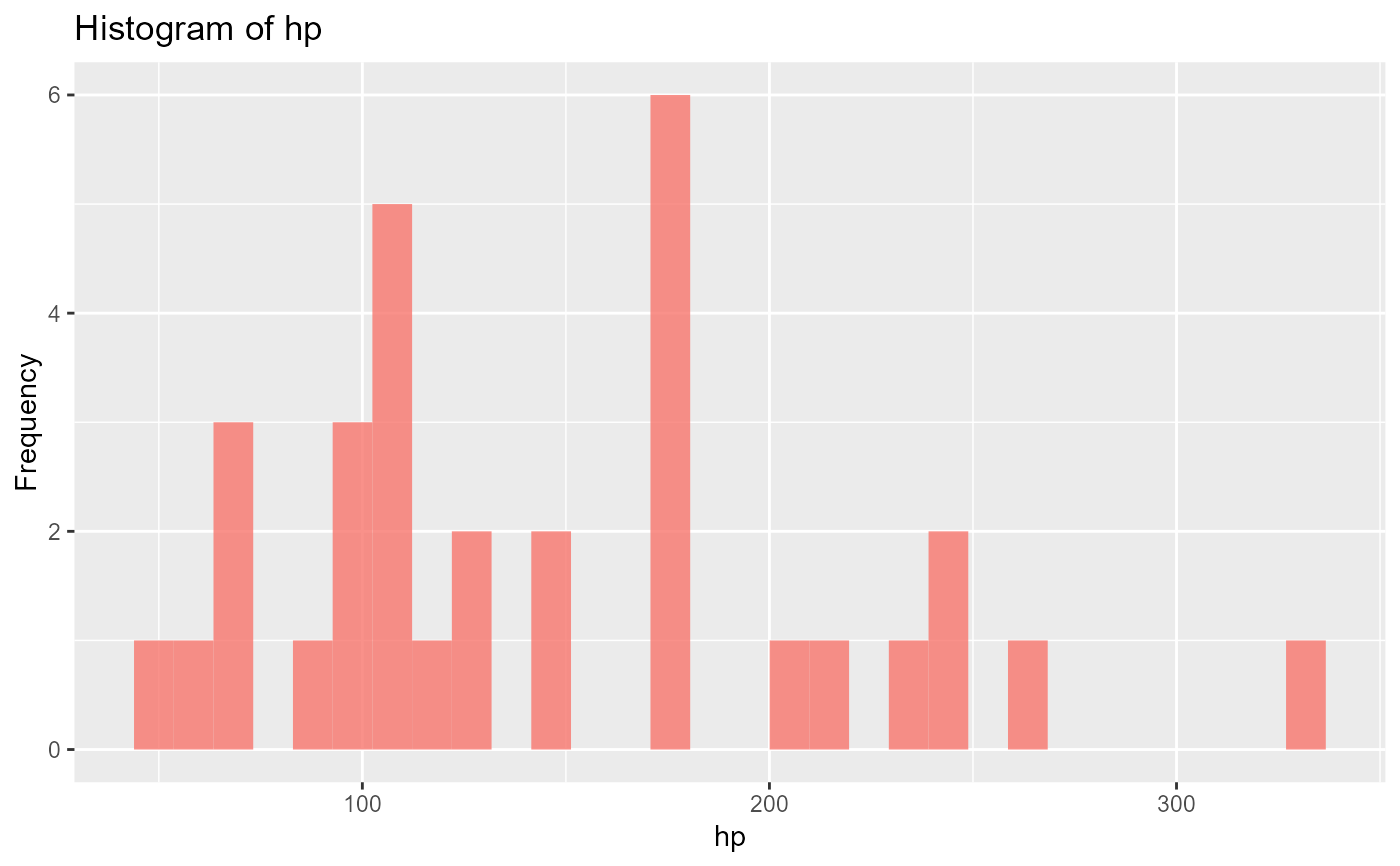
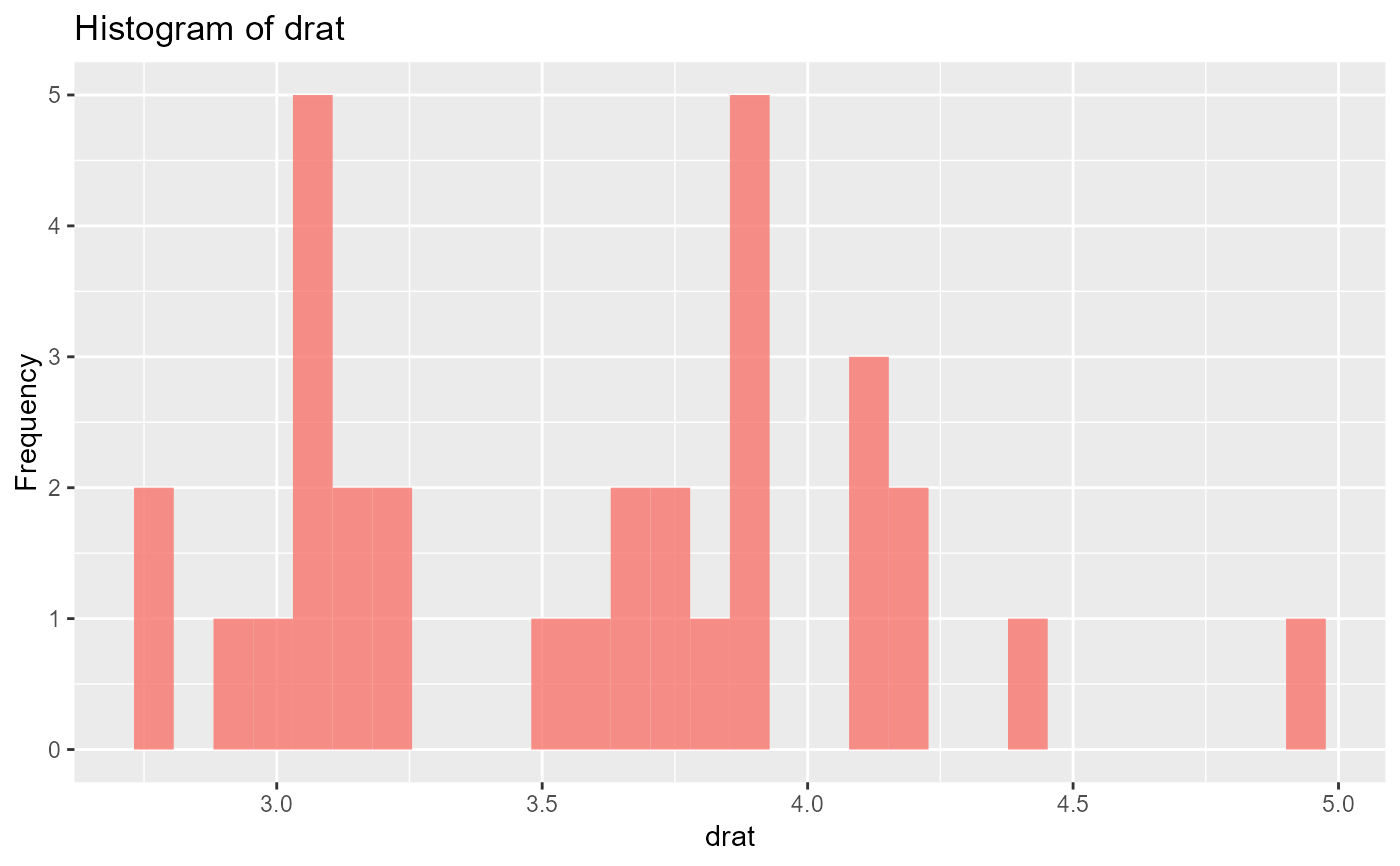
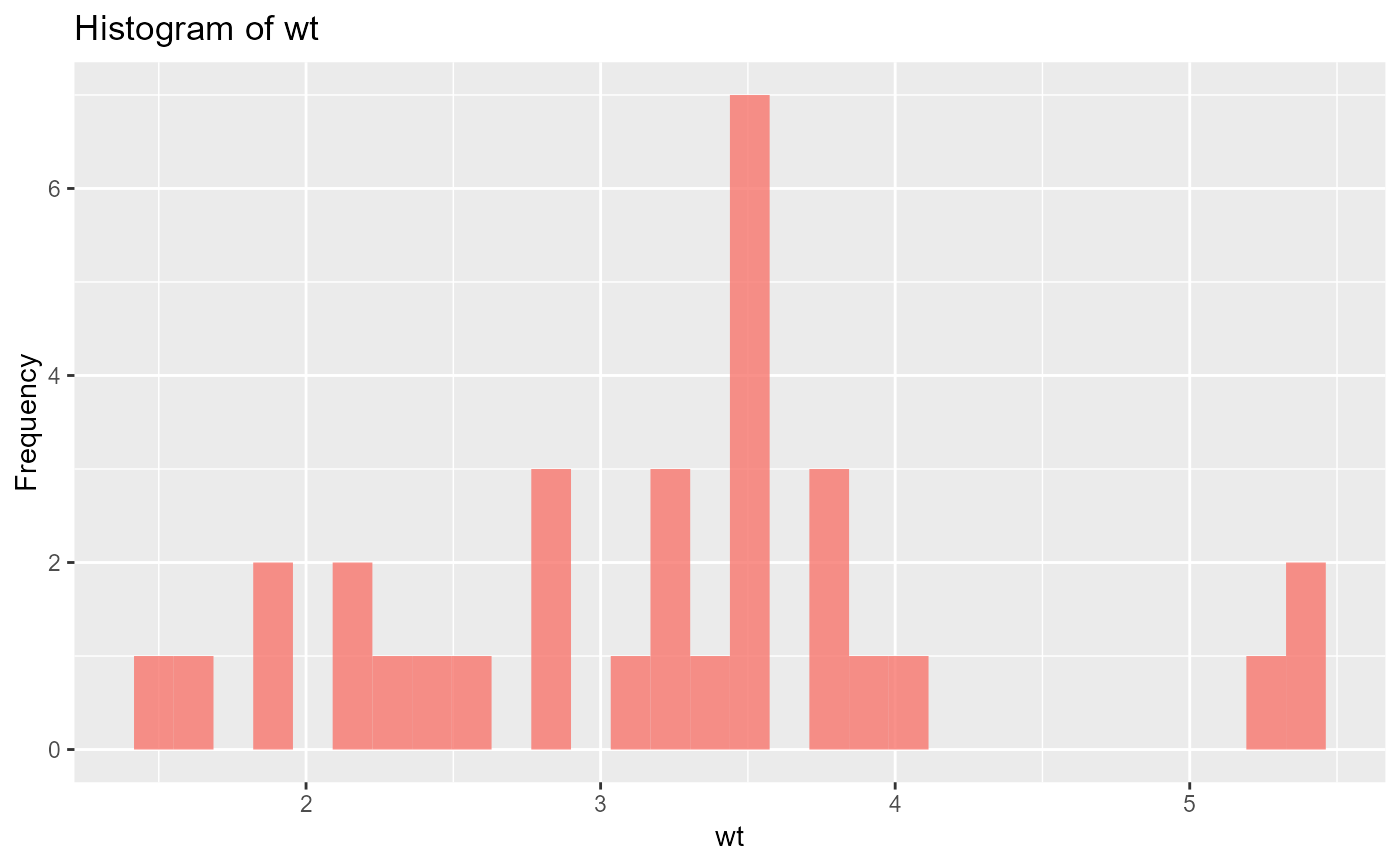
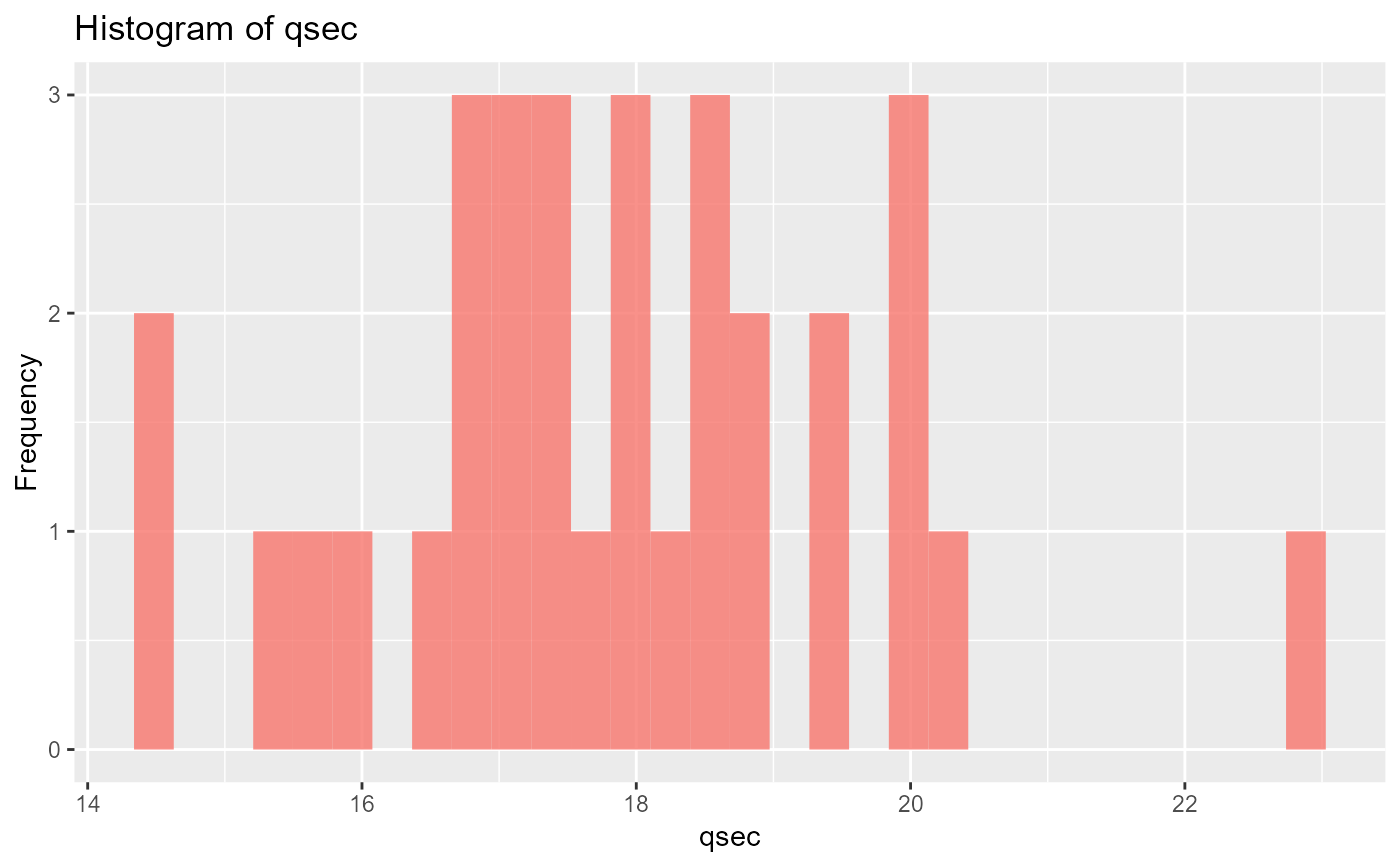
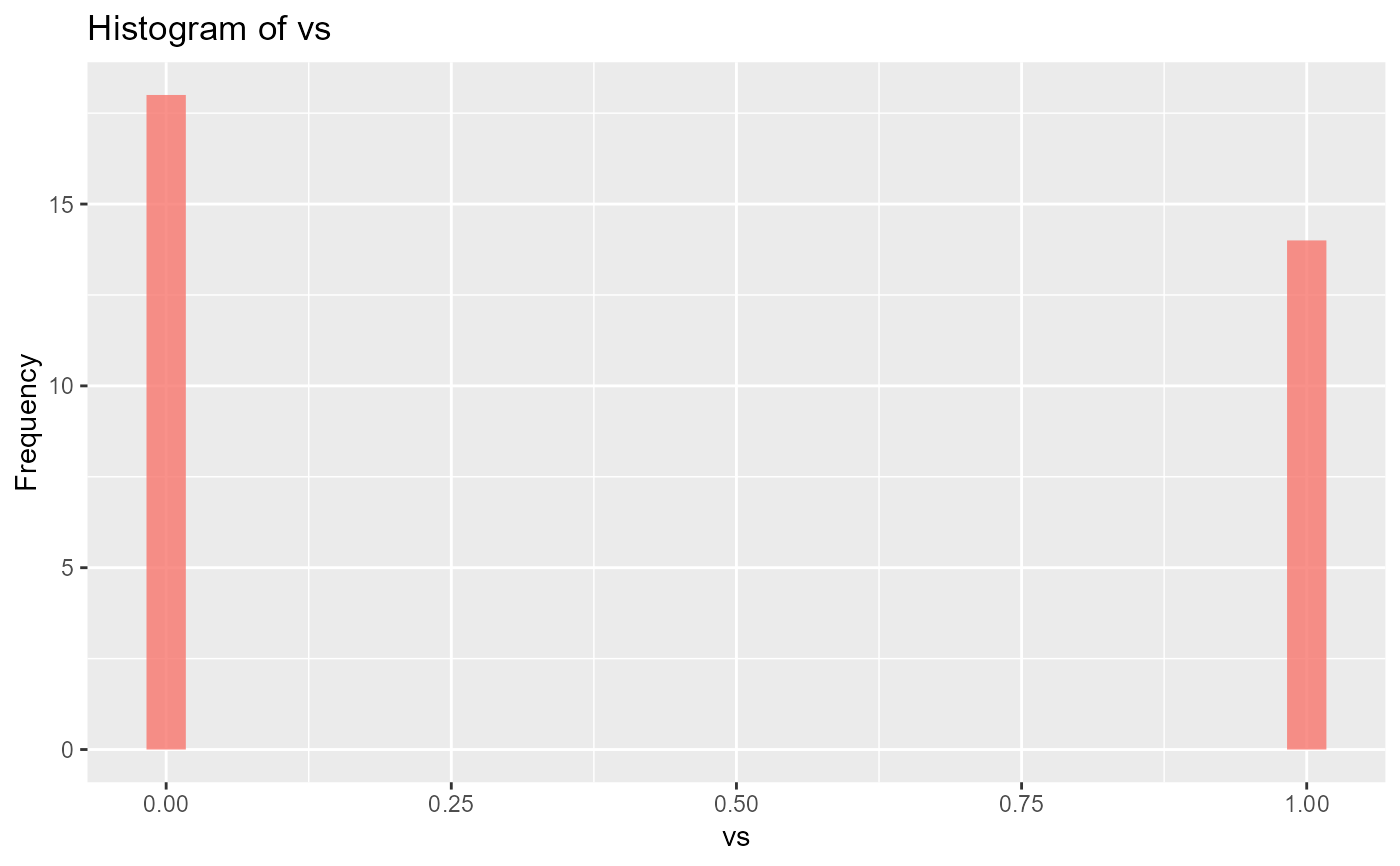
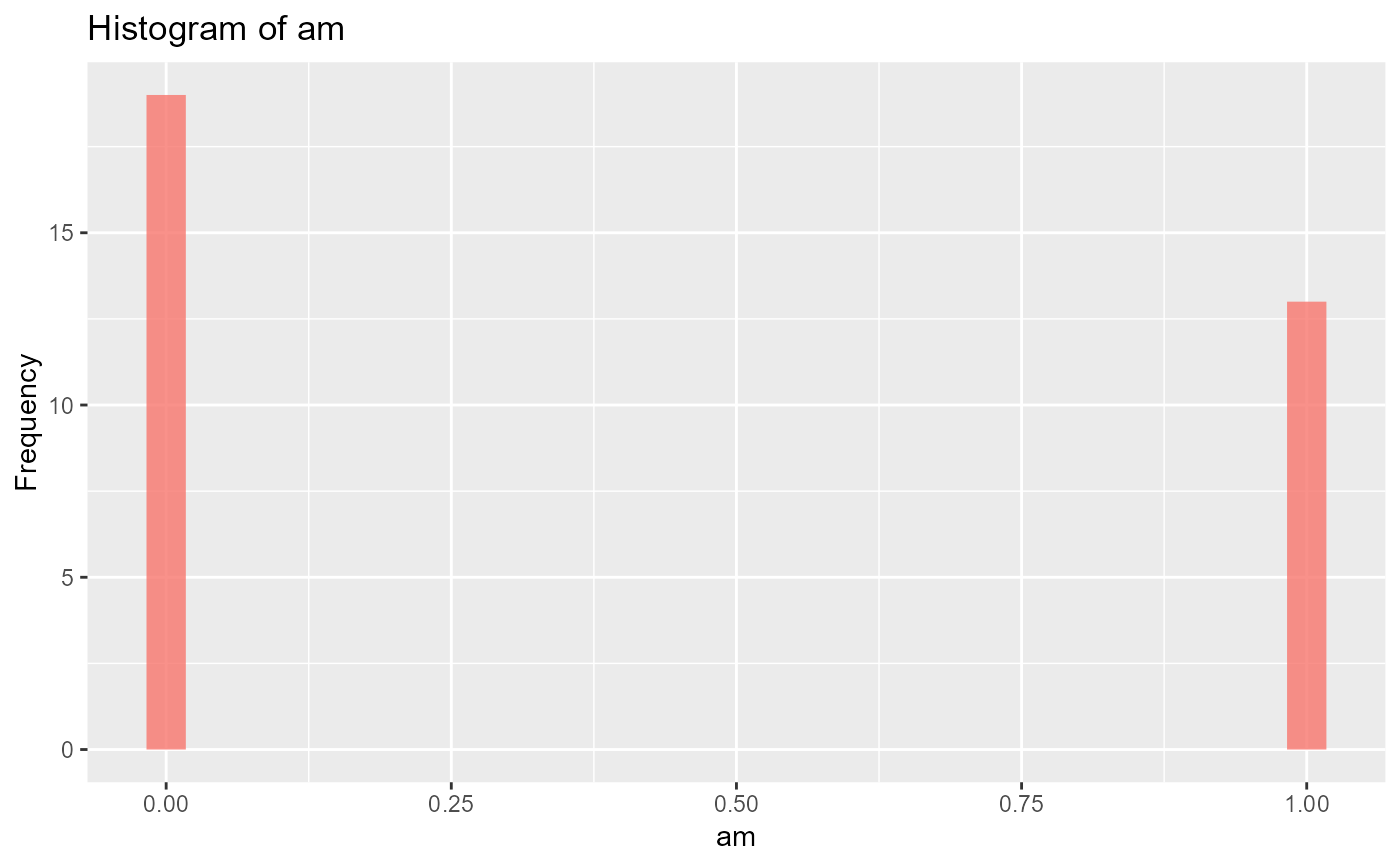
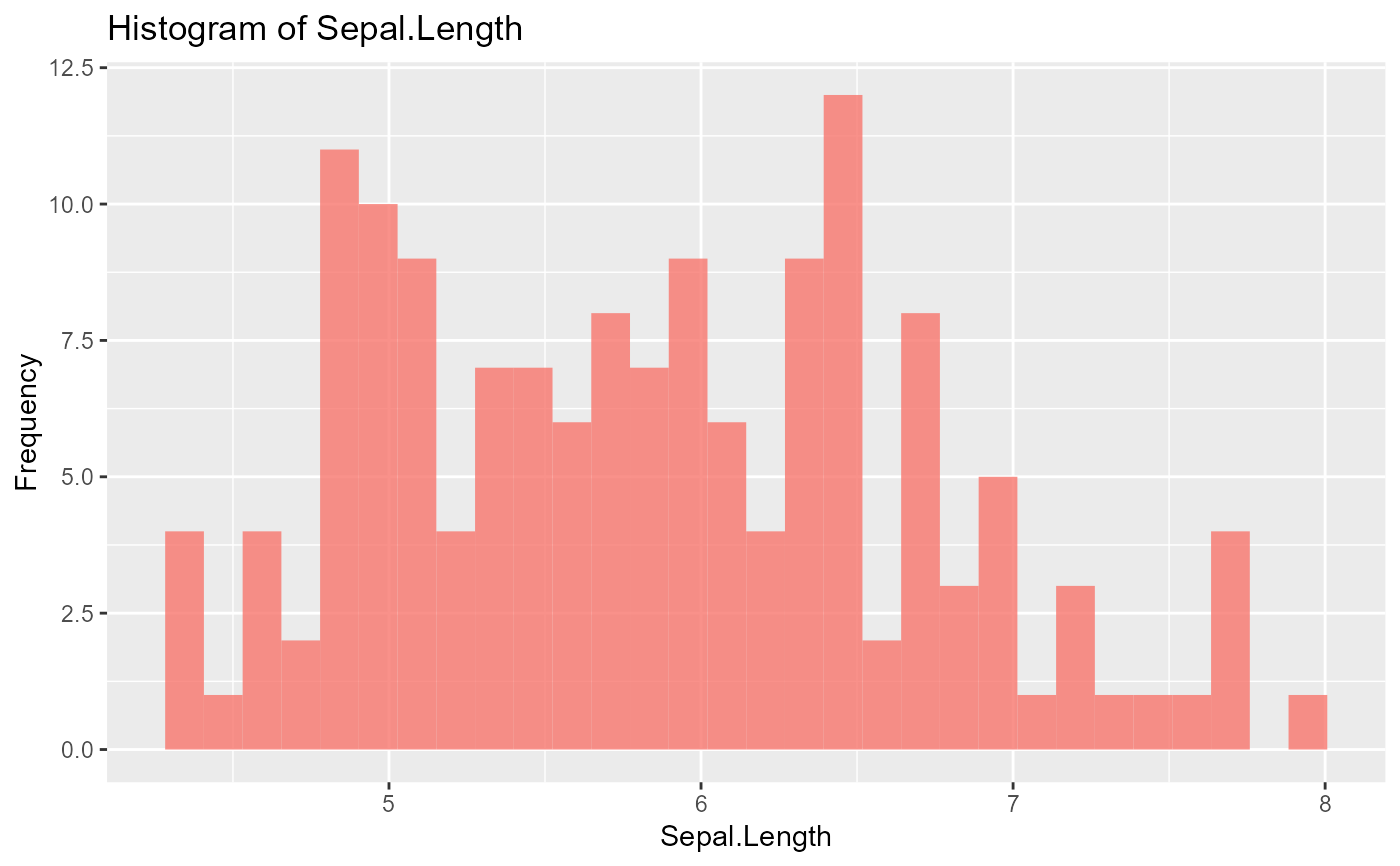
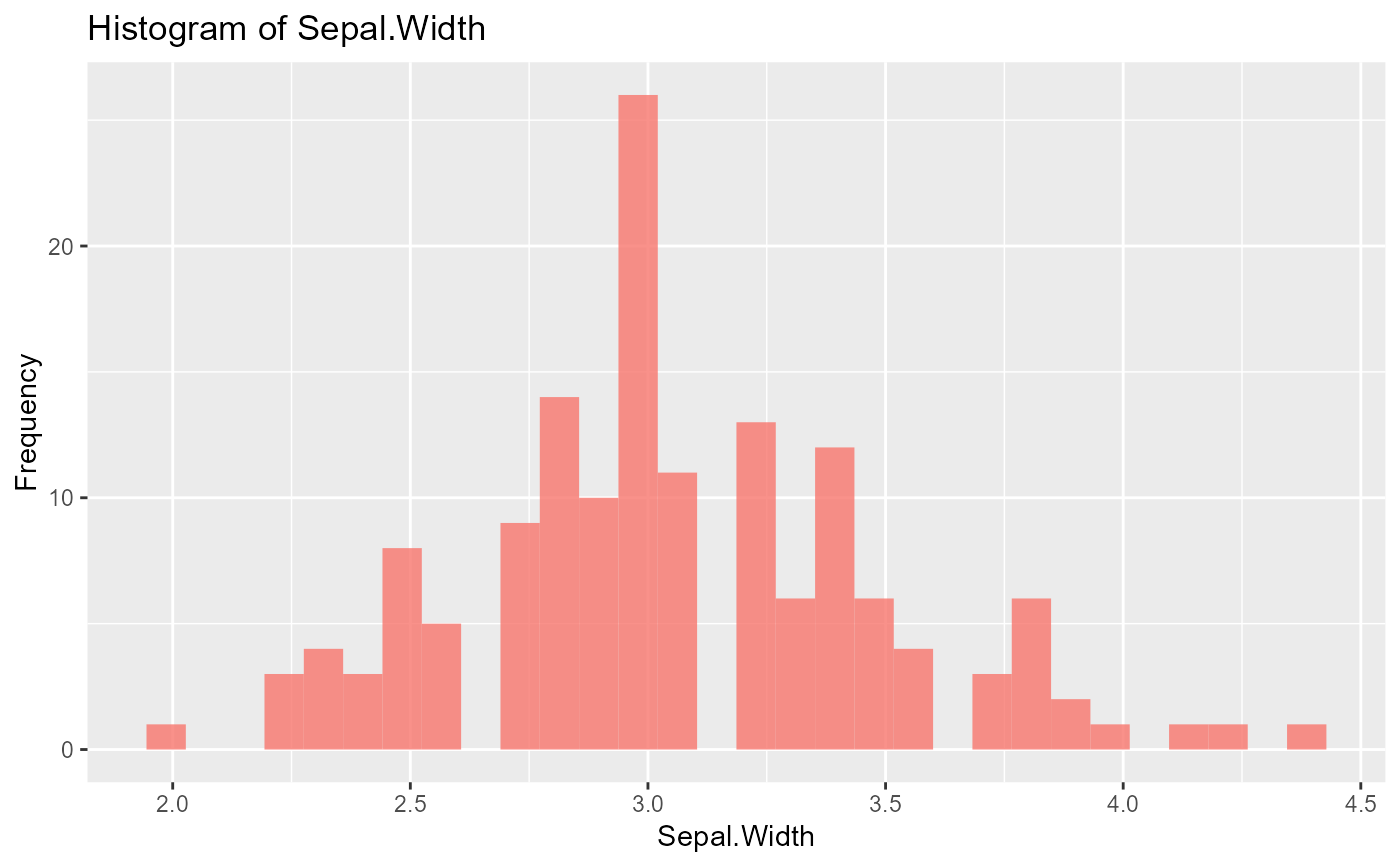
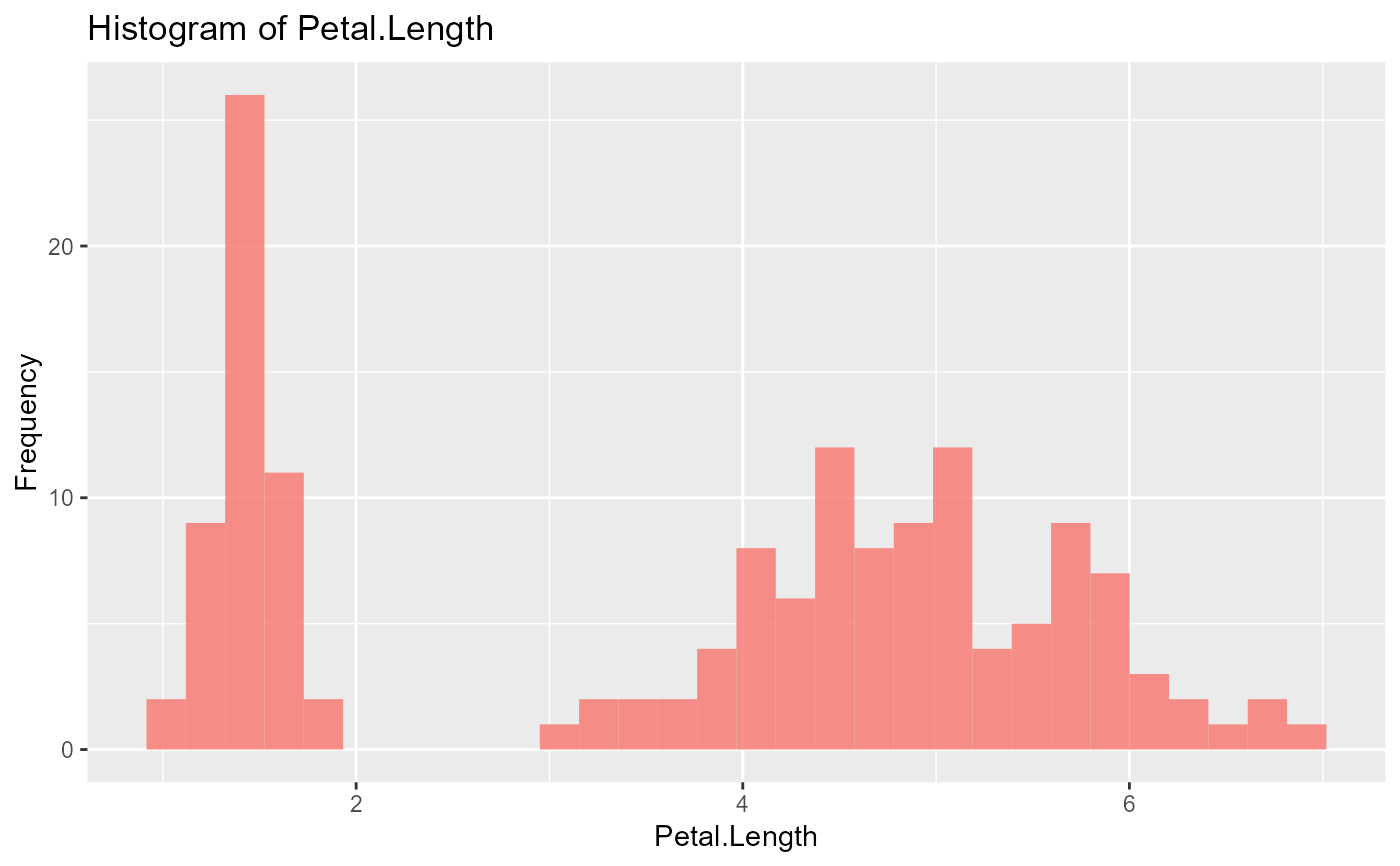
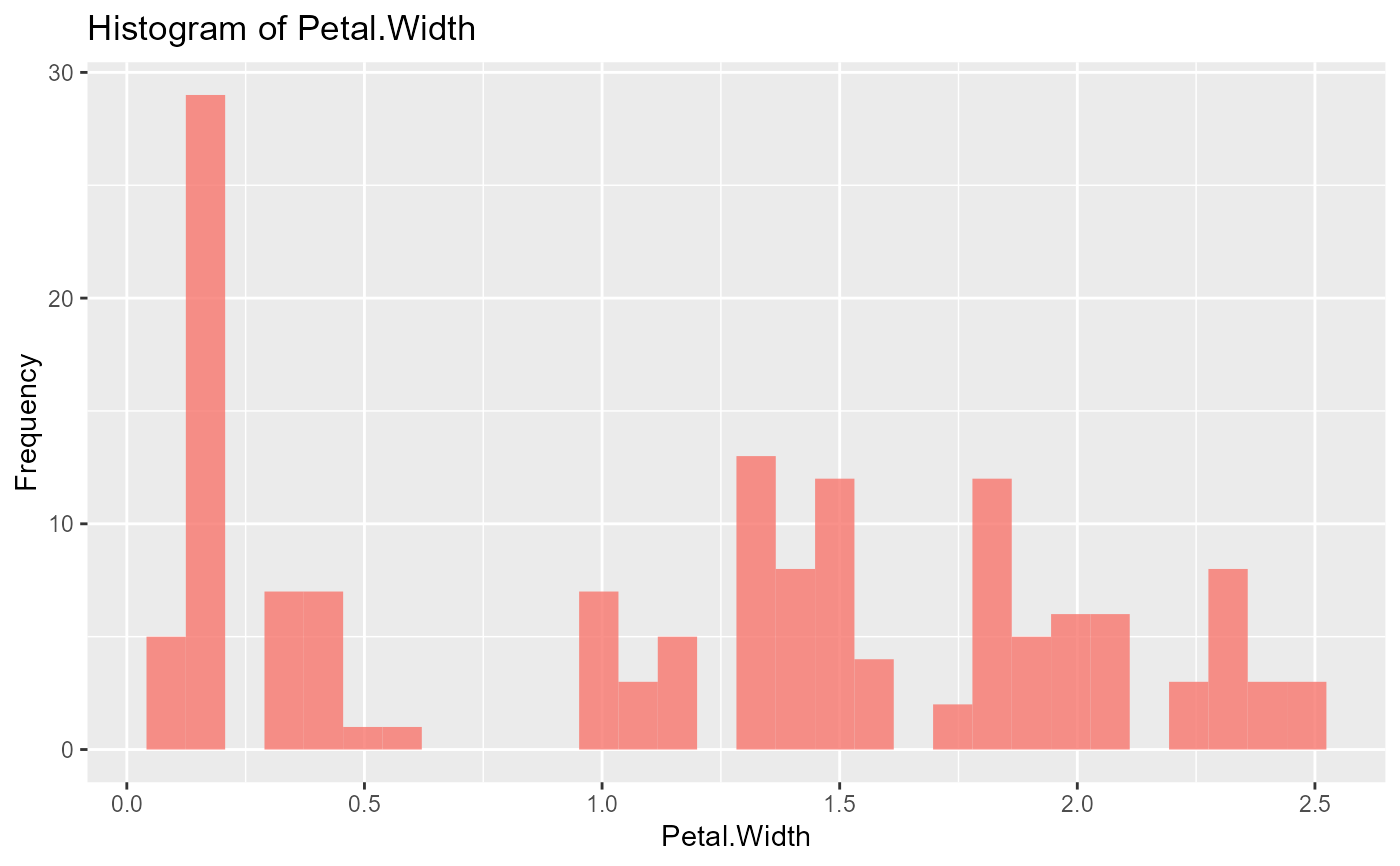
The plot_hist_vars function creates a series of histogram plots for the numeric variables of a data frame. The function allows users to specify which variables to include in the plots and how many plots to display per page. The function makes use of the ggplot2 and patchwork packages to create the plots and combine them into a single page.
plot_hist_vars(data, vars, plots_per_page = 6)Arguments
- data
a data frame
- vars
a character vector of variable names to include in the plots. If NULL (default), all numeric variables are used.
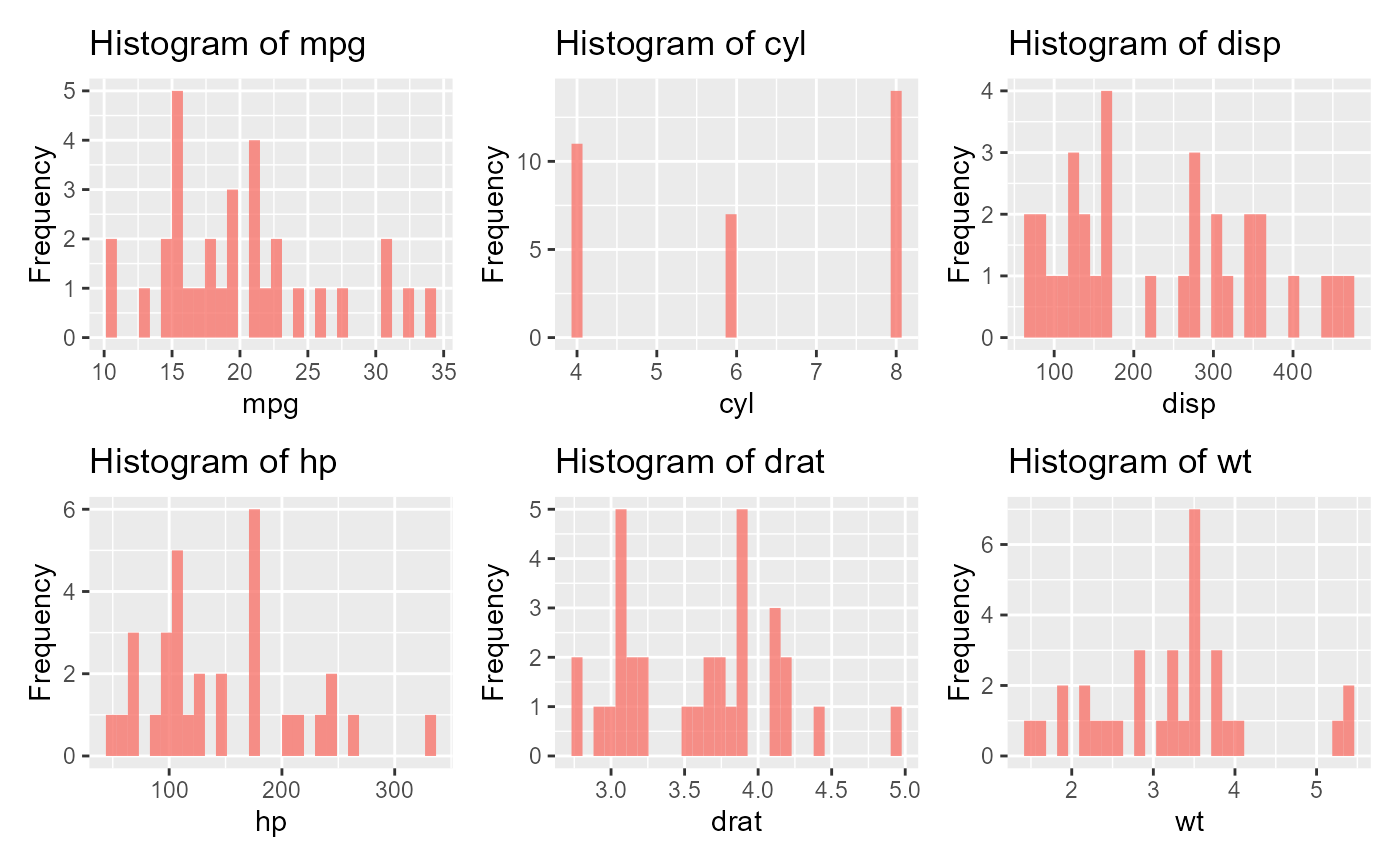
- plots_per_page
an integer indicating the number of plots to display per page. Default is 6.
Value
series of histogram plots to the R console.
Examples
library(ggplot2)
library(patchwork)
#> Warning: package 'patchwork' was built under R version 4.2.3
data(mtcars)
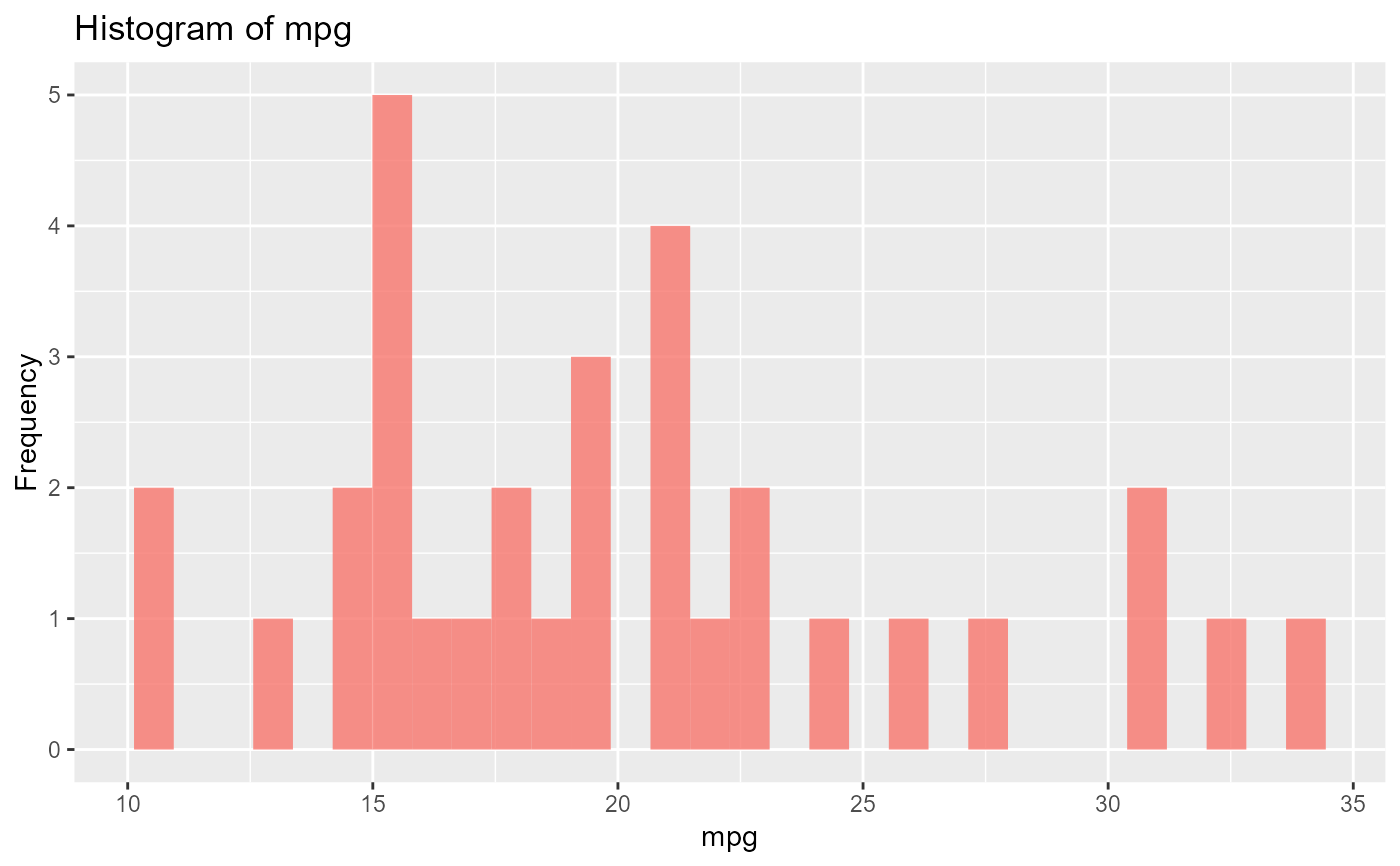
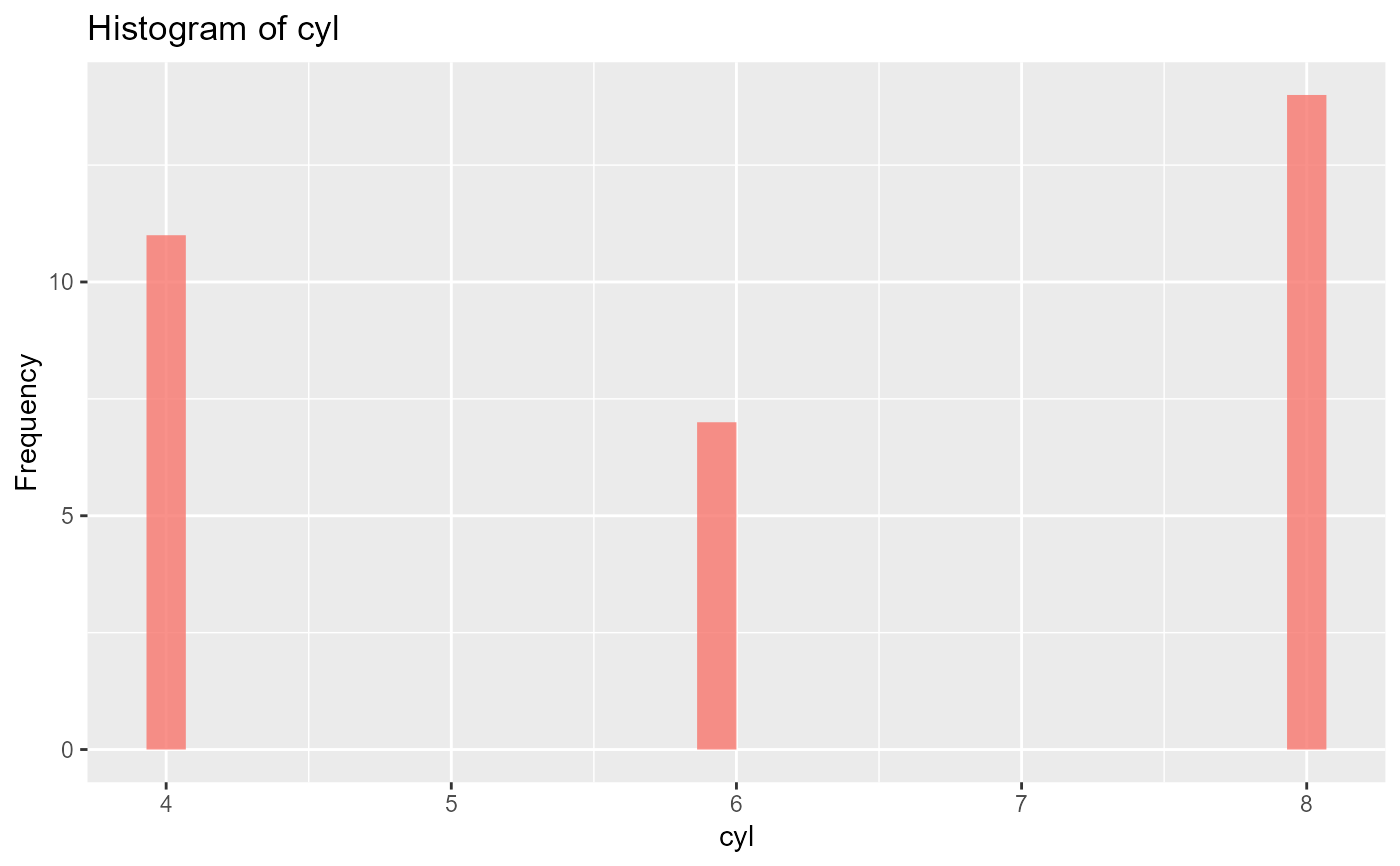
plot_hist_vars(mtcars, c("mpg", "cyl"))
 #> [[1]]
 #>
#> [[2]]
#>
#> [[2]]
 #>
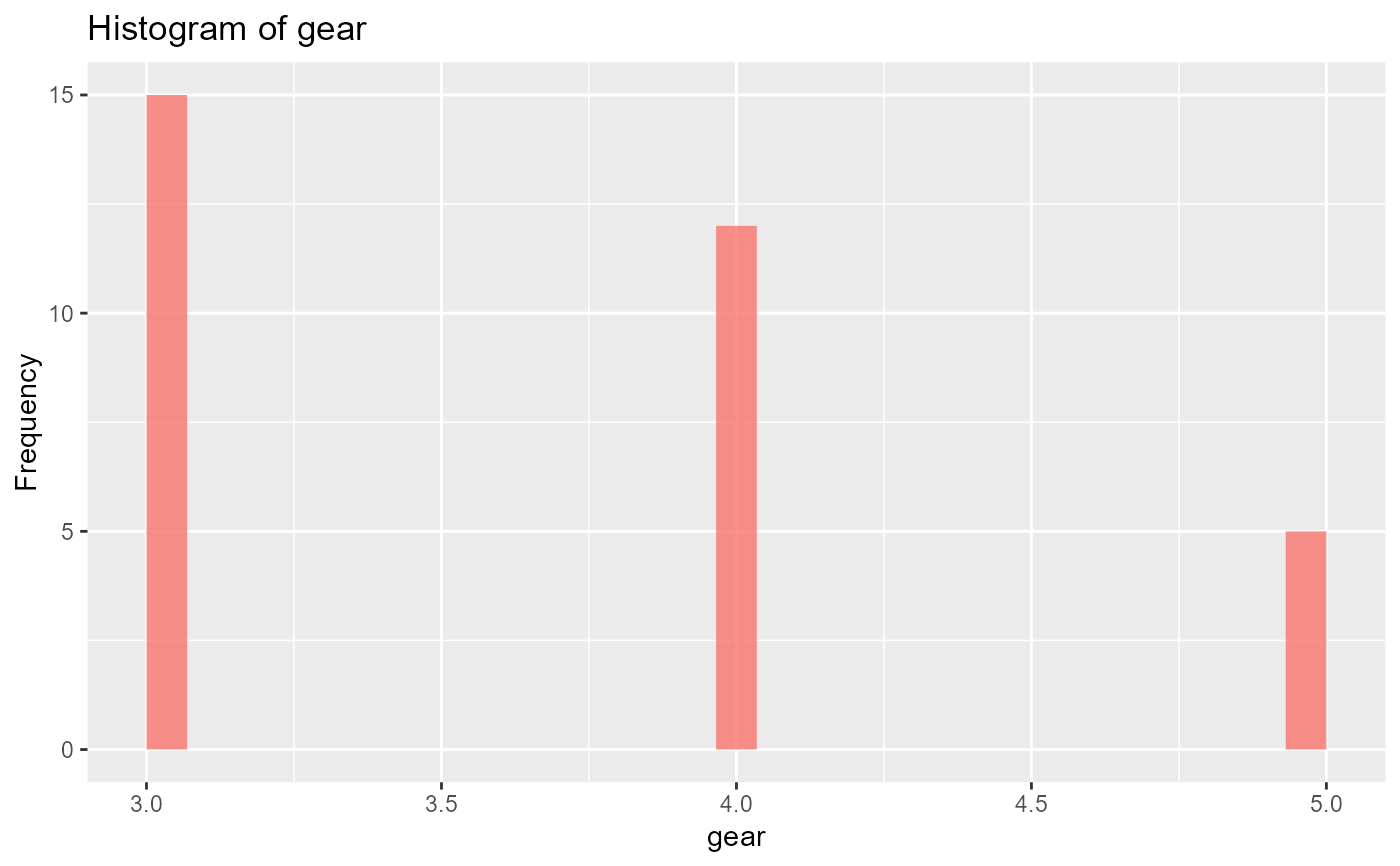
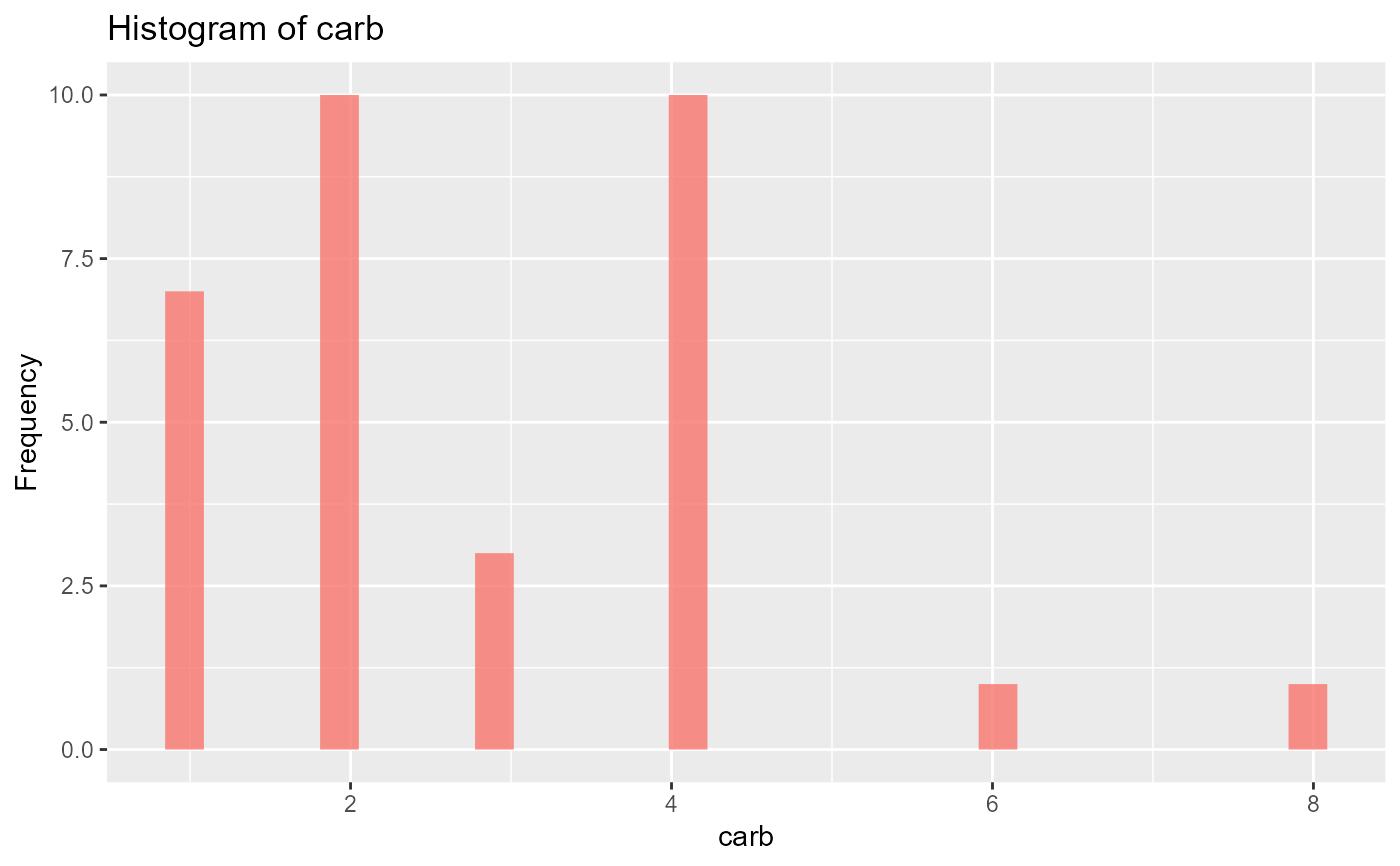
data(mtcars)
plot_hist_vars(mtcars)
#>
data(mtcars)
plot_hist_vars(mtcars)
 #> [[1]]
 #>
#> [[2]]
#>
#> [[2]]
 #>
#> [[3]]
#>
#> [[3]]
 #>
#> [[4]]
#>
#> [[4]]
 #>
#> [[5]]
#>
#> [[5]]
 #>
#> [[6]]
#>
#> [[6]]
 #>
#> [[7]]
#>
#> [[7]]
 #>
#> [[8]]
#>
#> [[8]]
 #>
#> [[9]]
#>
#> [[9]]
 #>
#> [[10]]
#>
#> [[10]]
 #>
#> [[11]]
#>
#> [[11]]
 #>
data(iris)
plot_hist_vars(iris, c("Sepal.Length", "Petal.Length", "Species"))
#> Warning: Following columns are not numeric: Species
#>
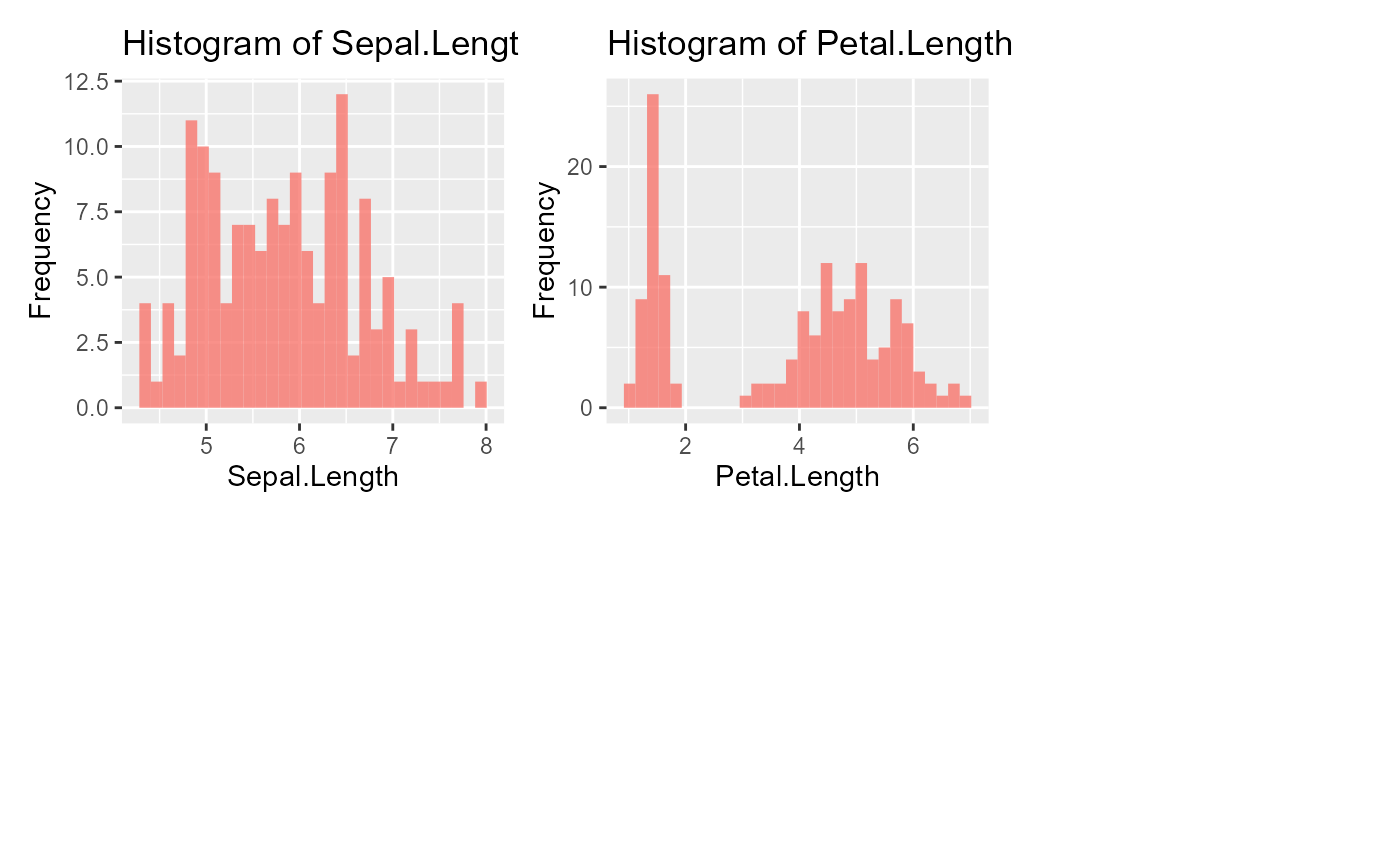
data(iris)
plot_hist_vars(iris, c("Sepal.Length", "Petal.Length", "Species"))
#> Warning: Following columns are not numeric: Species
 #> [[1]]
 #>
#> [[2]]
#>
#> [[2]]
 #>
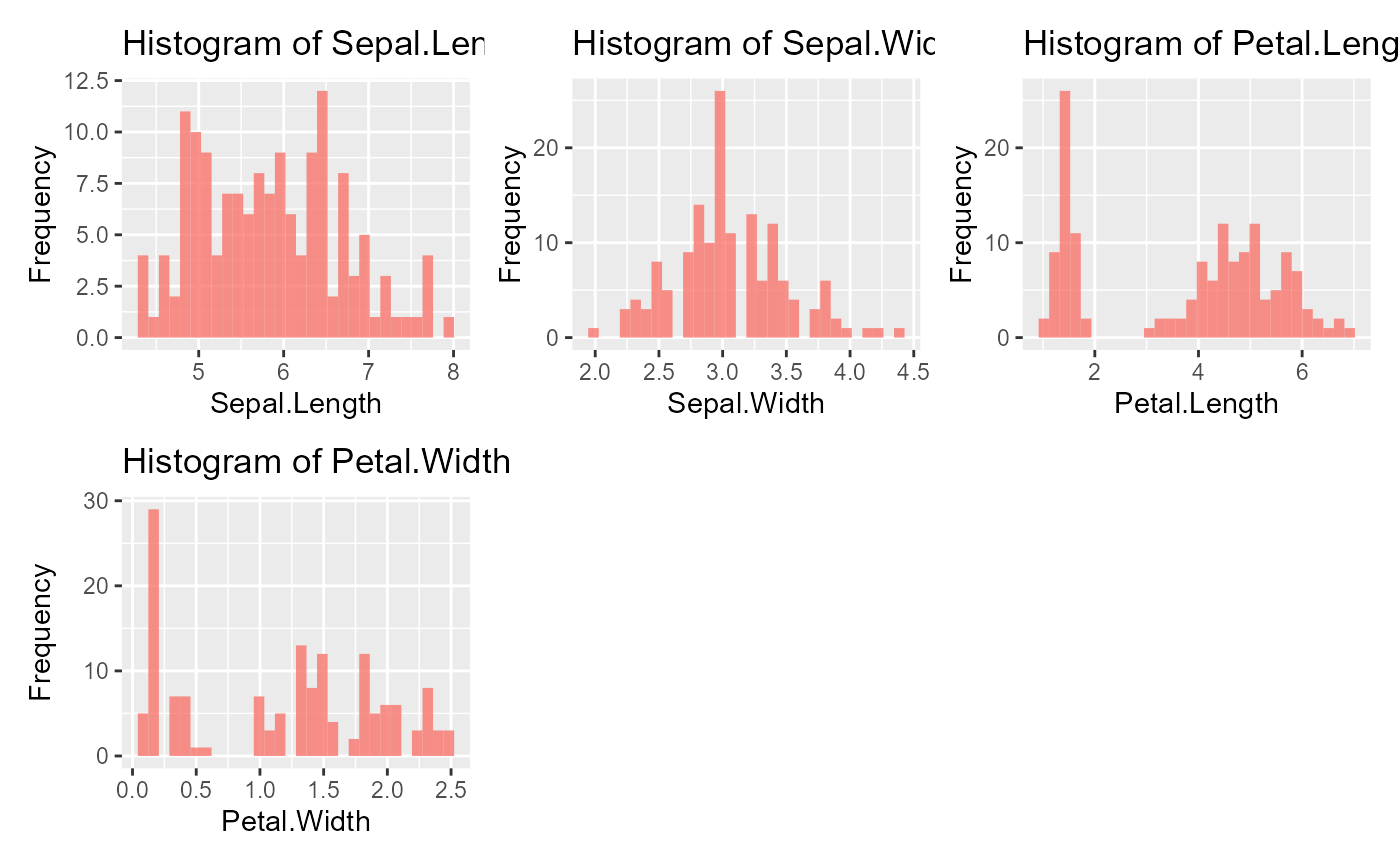
data(iris)
plot_hist_vars(iris)
#>
data(iris)
plot_hist_vars(iris)
 #> [[1]]
 #>
#> [[2]]
#>
#> [[2]]
 #>
#> [[3]]
#>
#> [[3]]
 #>
#> [[4]]
#>
#> [[4]]
 #>
#>