Draws numeric plots (boxplots and violin plots) by target for selected columns.
Source:R/plot_num_plots.R
plot_num_plots.RdDraws numeric plots (boxplots and violin plots) by target for selected columns.
plot_num_plots(df, variables = colnames(df), target, plot_type = "boxplot")Arguments
- df
data frame with numeric values
- variables
column names to be included
- target
name of target column
- plot_type
type of plots, 'boxplot' or 'violin'
Value
list of plots
Examples
library("toRpEDA")
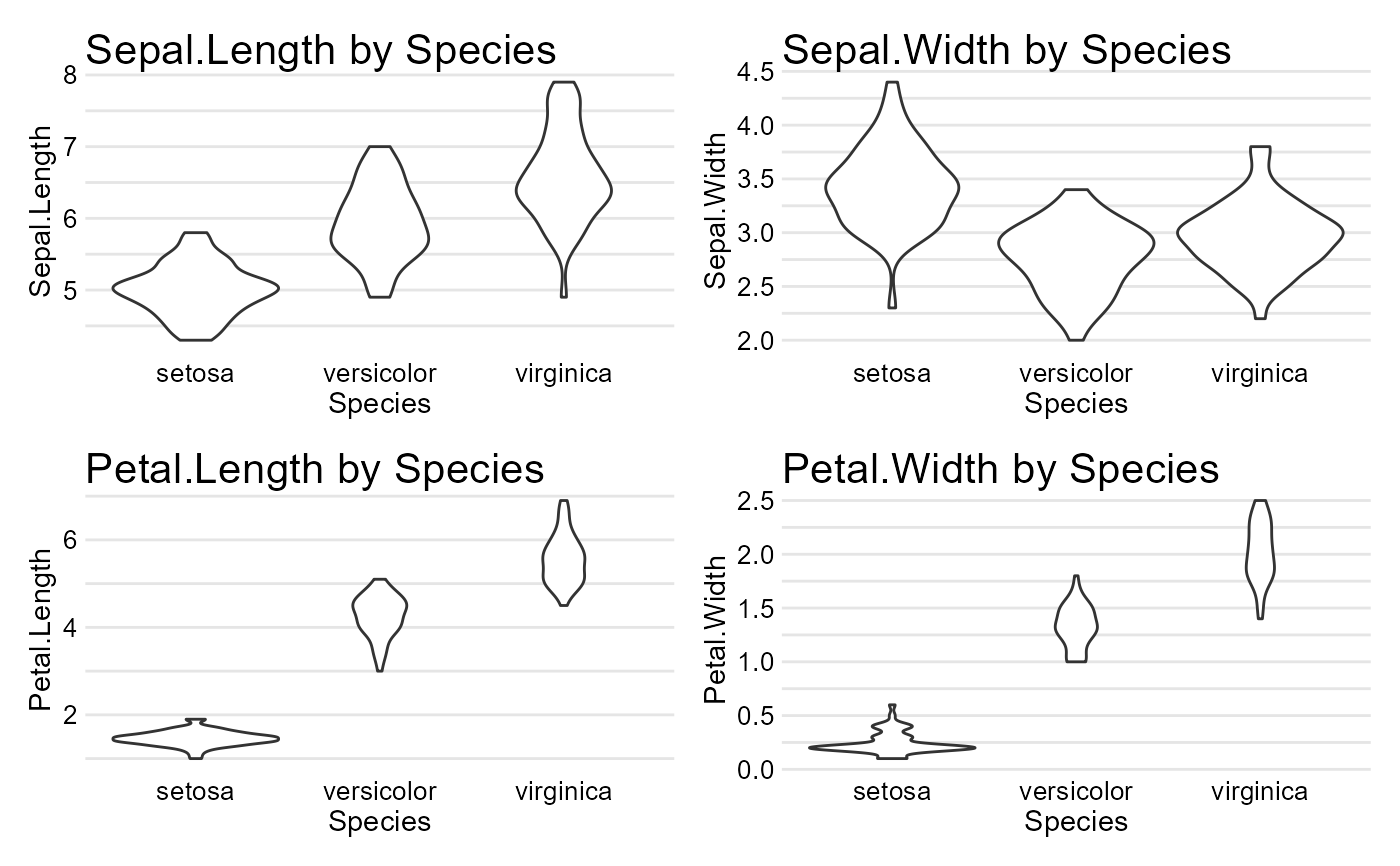
# drawing 4 plots
plot_num_plots(iris, target = "Species", plot_type="violin")
#> [[1]]
 #>
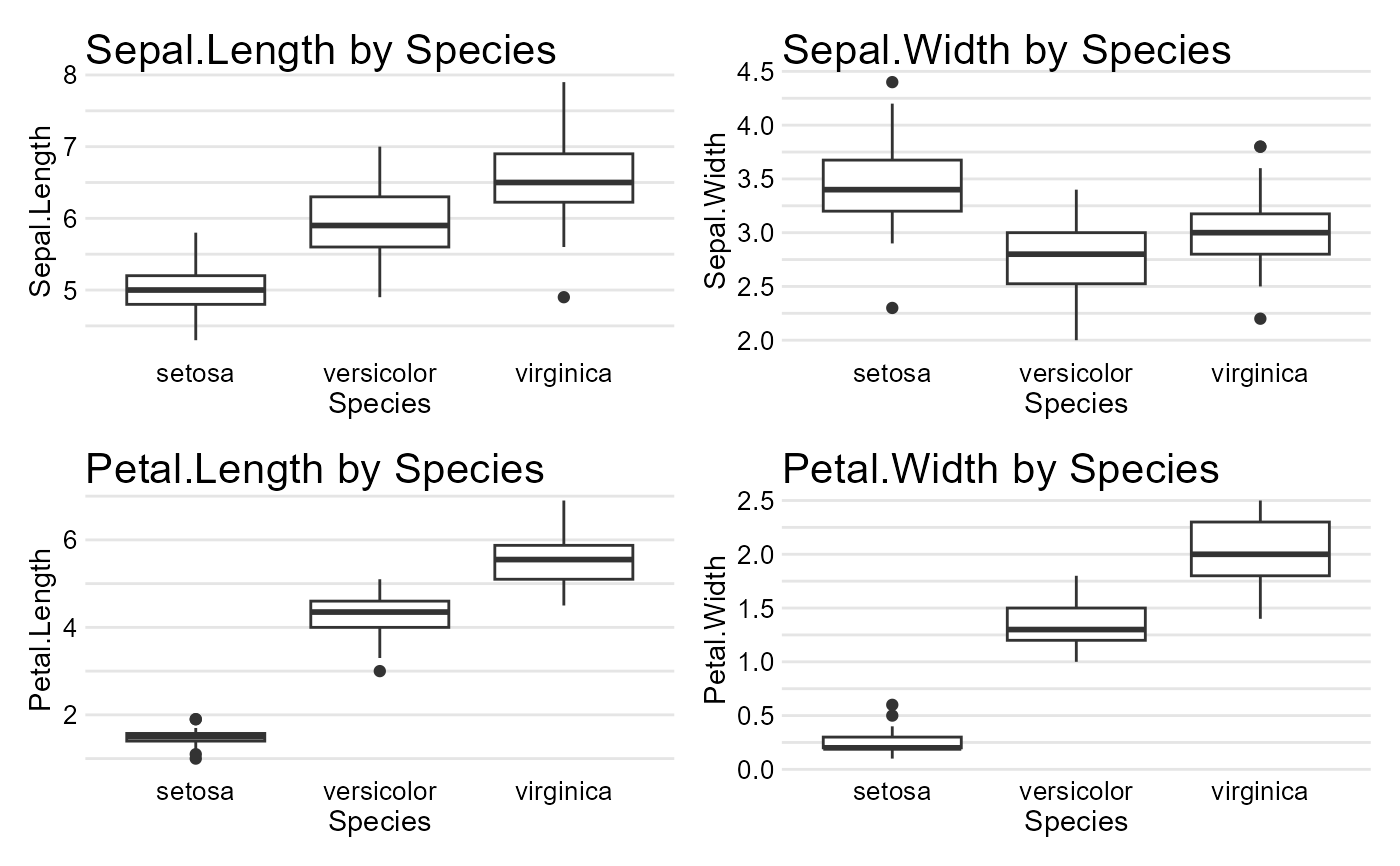
plot_num_plots(iris, target = "Species", plot_type="boxplot")
#> [[1]]
#>
plot_num_plots(iris, target = "Species", plot_type="boxplot")
#> [[1]]
 #>
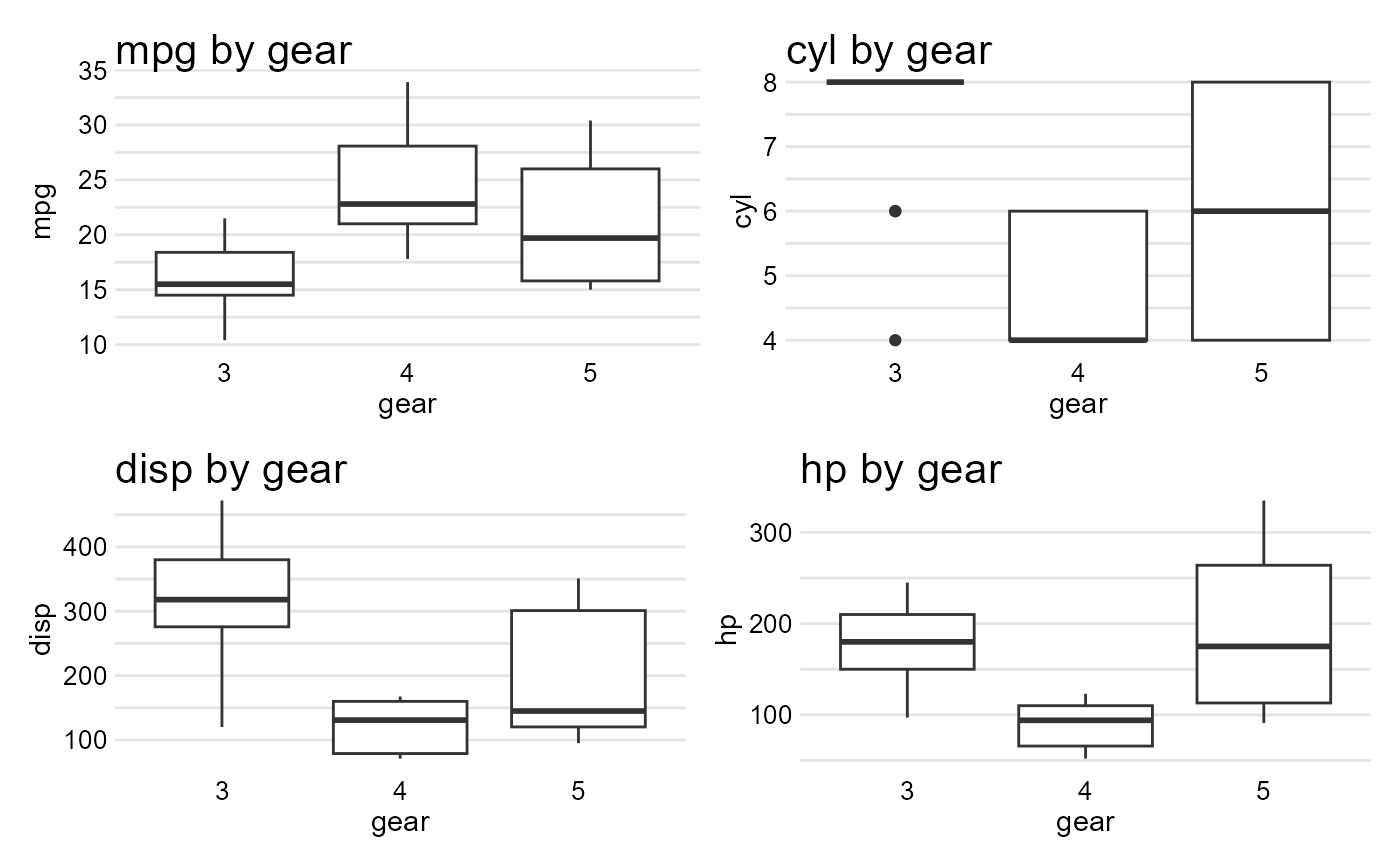
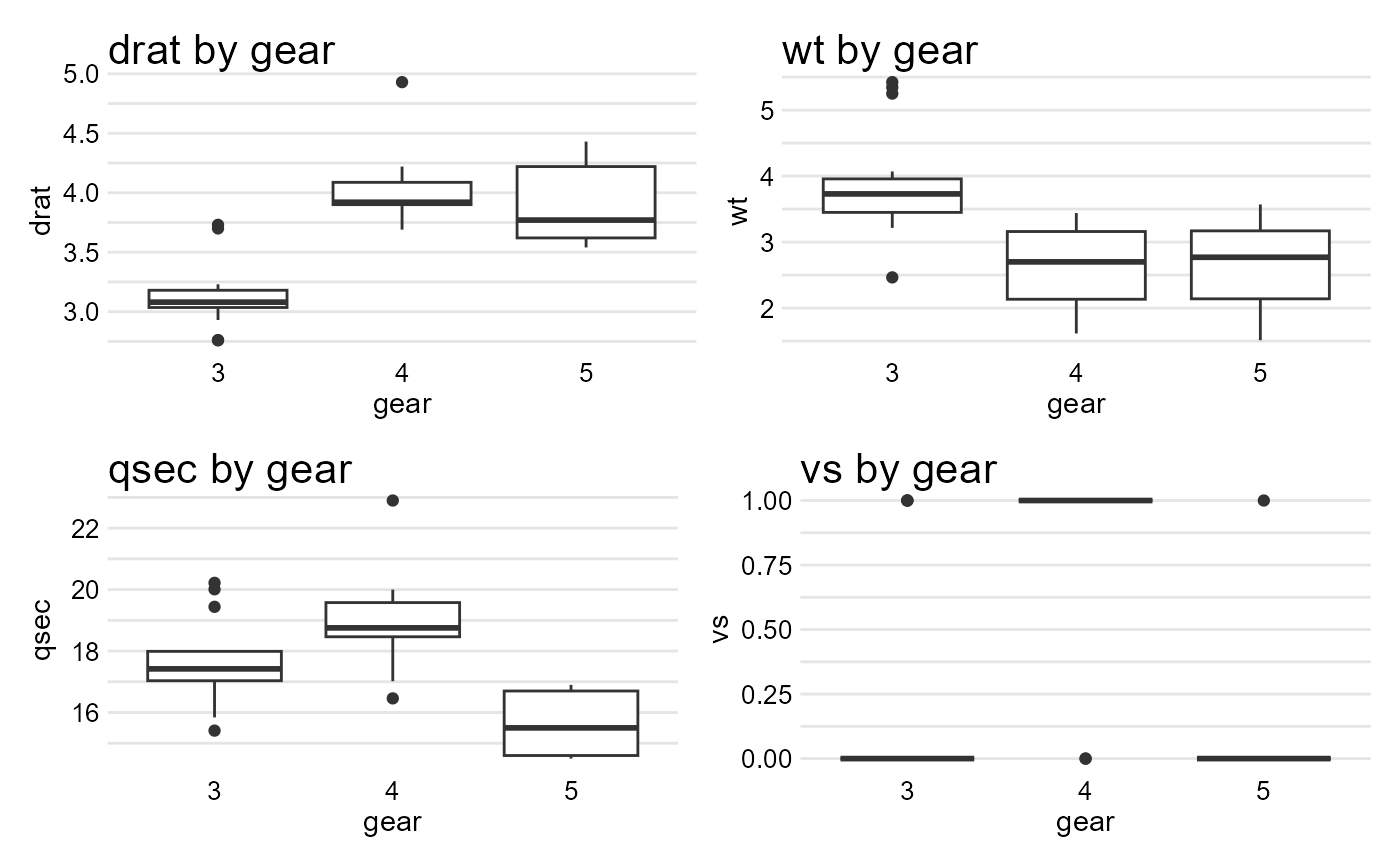
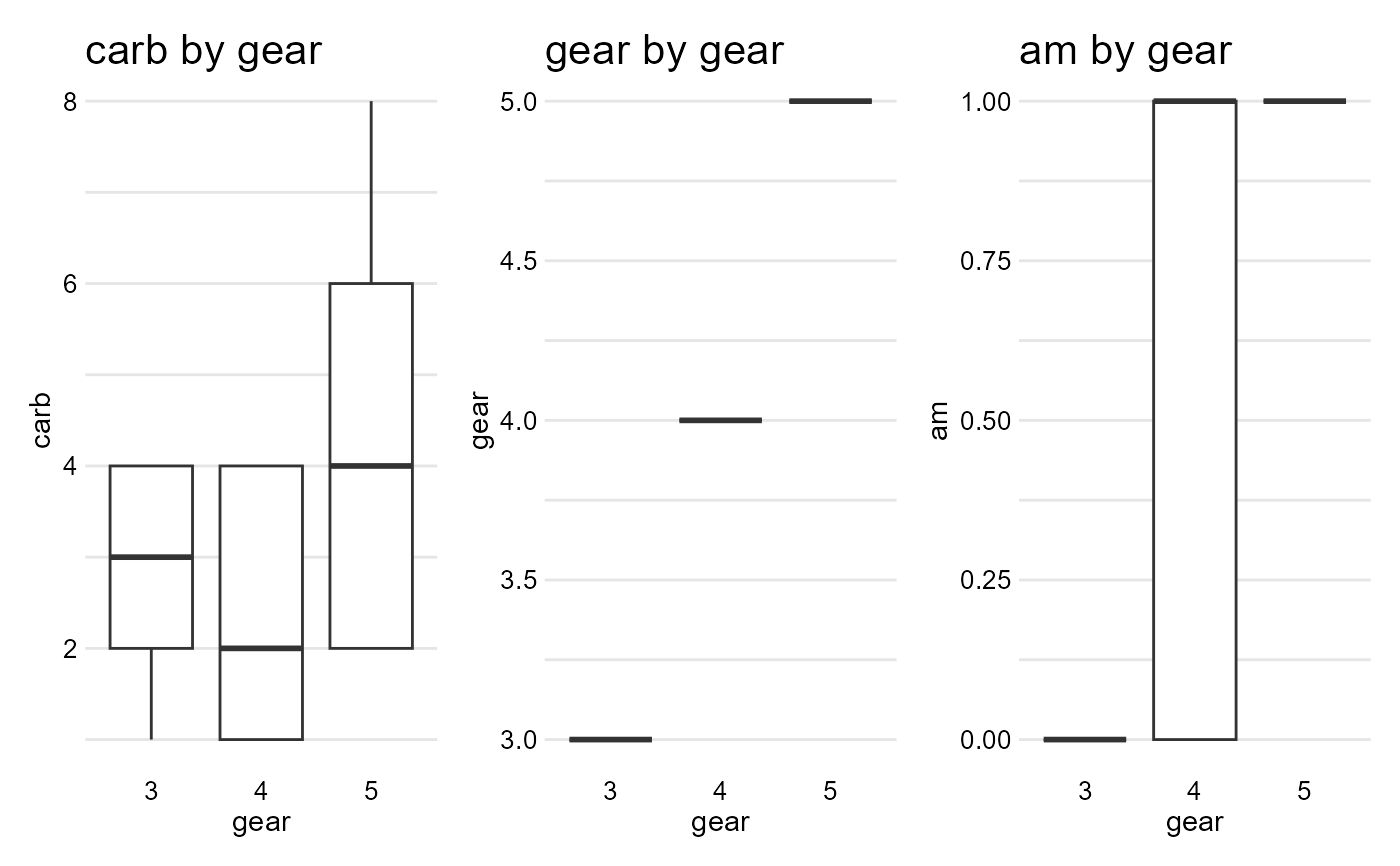
plot_num_plots(mtcars, target = "gear", plot_type="boxplot")
#> [[1]]
#>
plot_num_plots(mtcars, target = "gear", plot_type="boxplot")
#> [[1]]
 #>
#> [[2]]
#>
#> [[2]]
 #>
#> [[3]]
#>
#> [[3]]
 #>
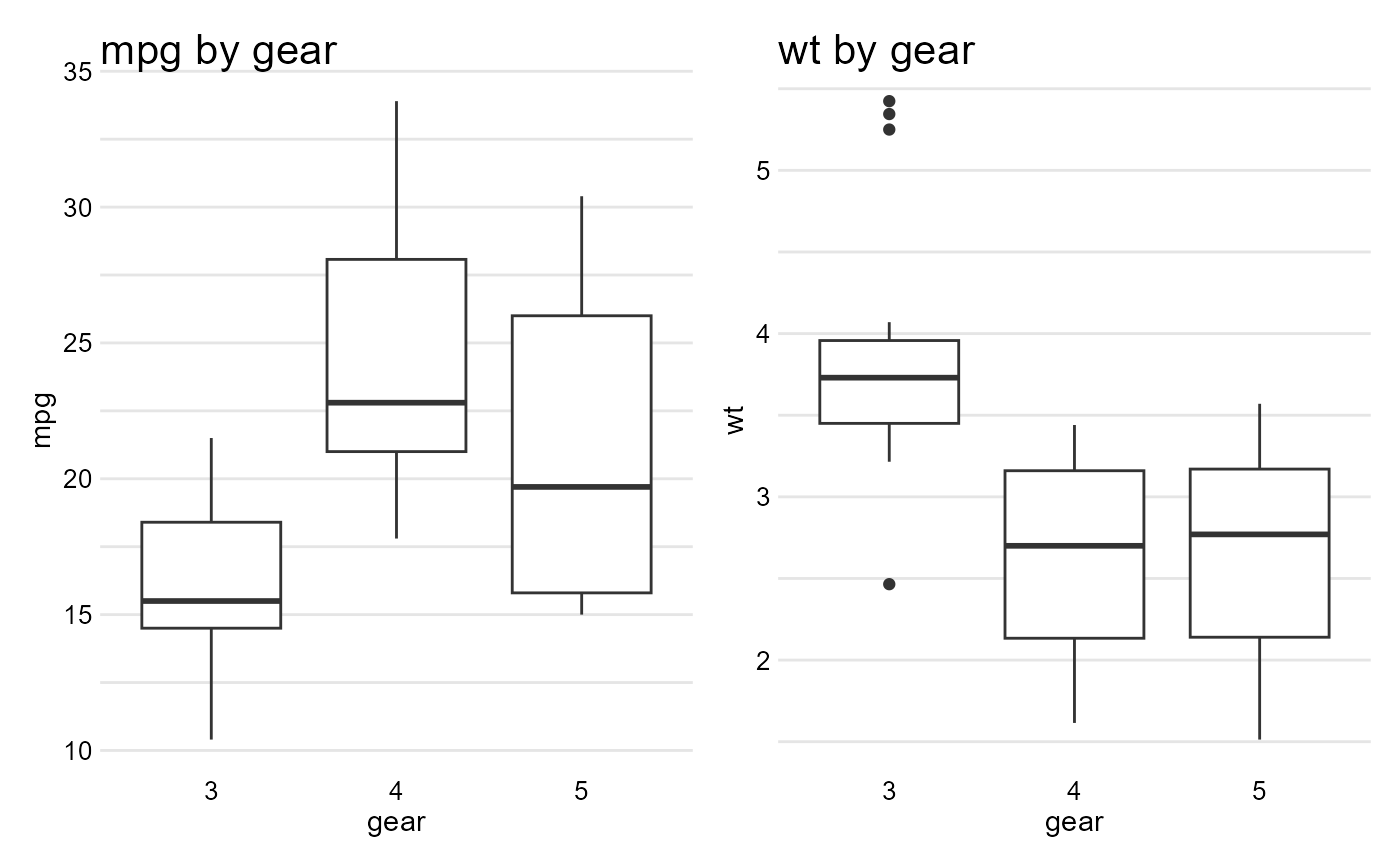
plot_num_plots(mtcars, variables = c("wt", "mpg"), target = "gear", plot_type="boxplot")
#> [[1]]
#>
plot_num_plots(mtcars, variables = c("wt", "mpg"), target = "gear", plot_type="boxplot")
#> [[1]]
 #>
#>