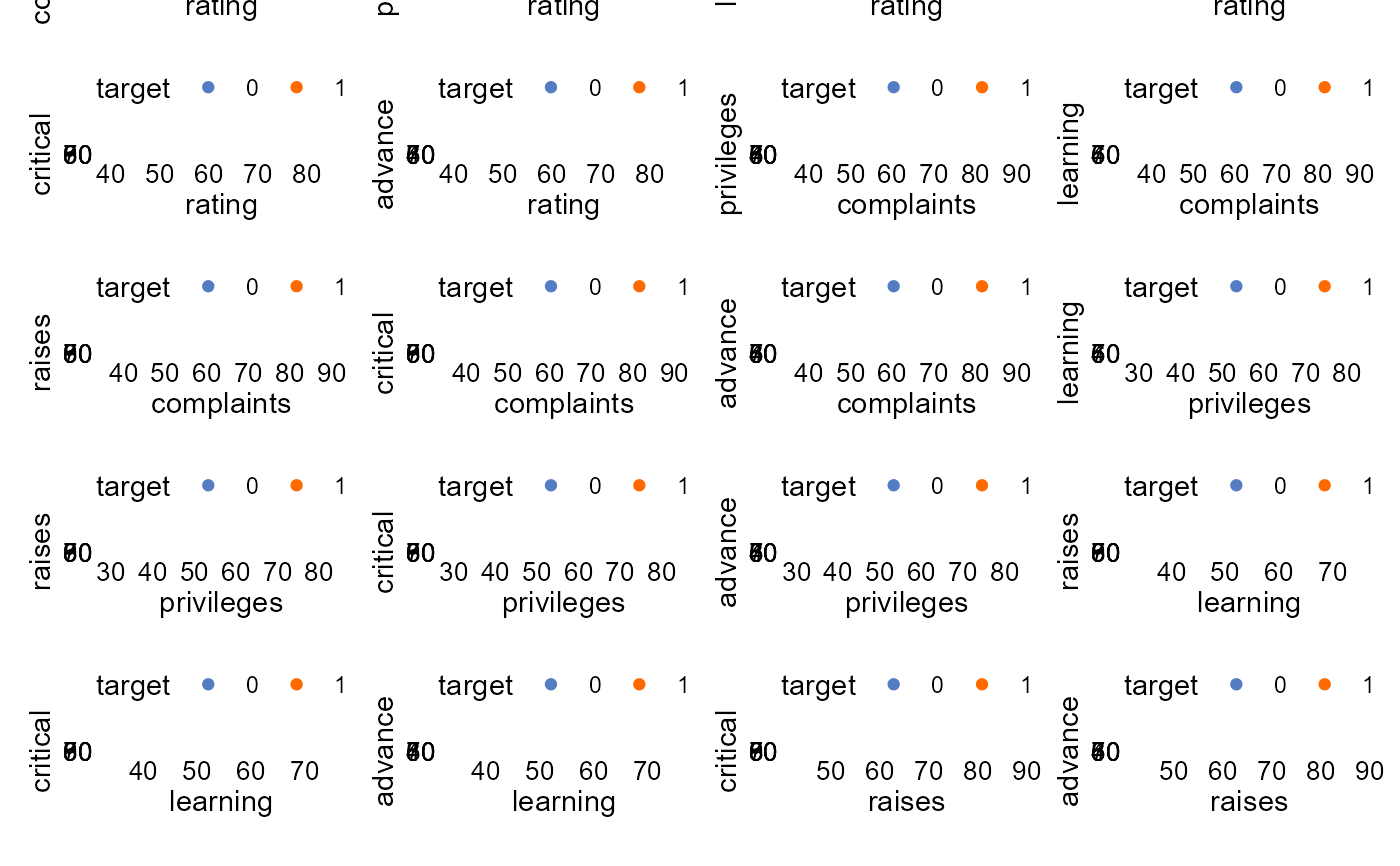
Function for displaying scatter plots of contninuous variables in data frame. Automatically picks columns of data frame and displays unique variables pairs scatter plots on one multi-faceted graphic. Column names can be specified. Color grouping by target can be added in case of classification task.
plot_scatter(df, vars, target = NULL)Arguments
- df
Data frame
- vars
(optonal) Vector with names of columns to include on plots.
- target
(optional) Name of target column to perform grouping on scatter plot.
Value
patchwork's list of ggplot objects